73
73peptides
spectra
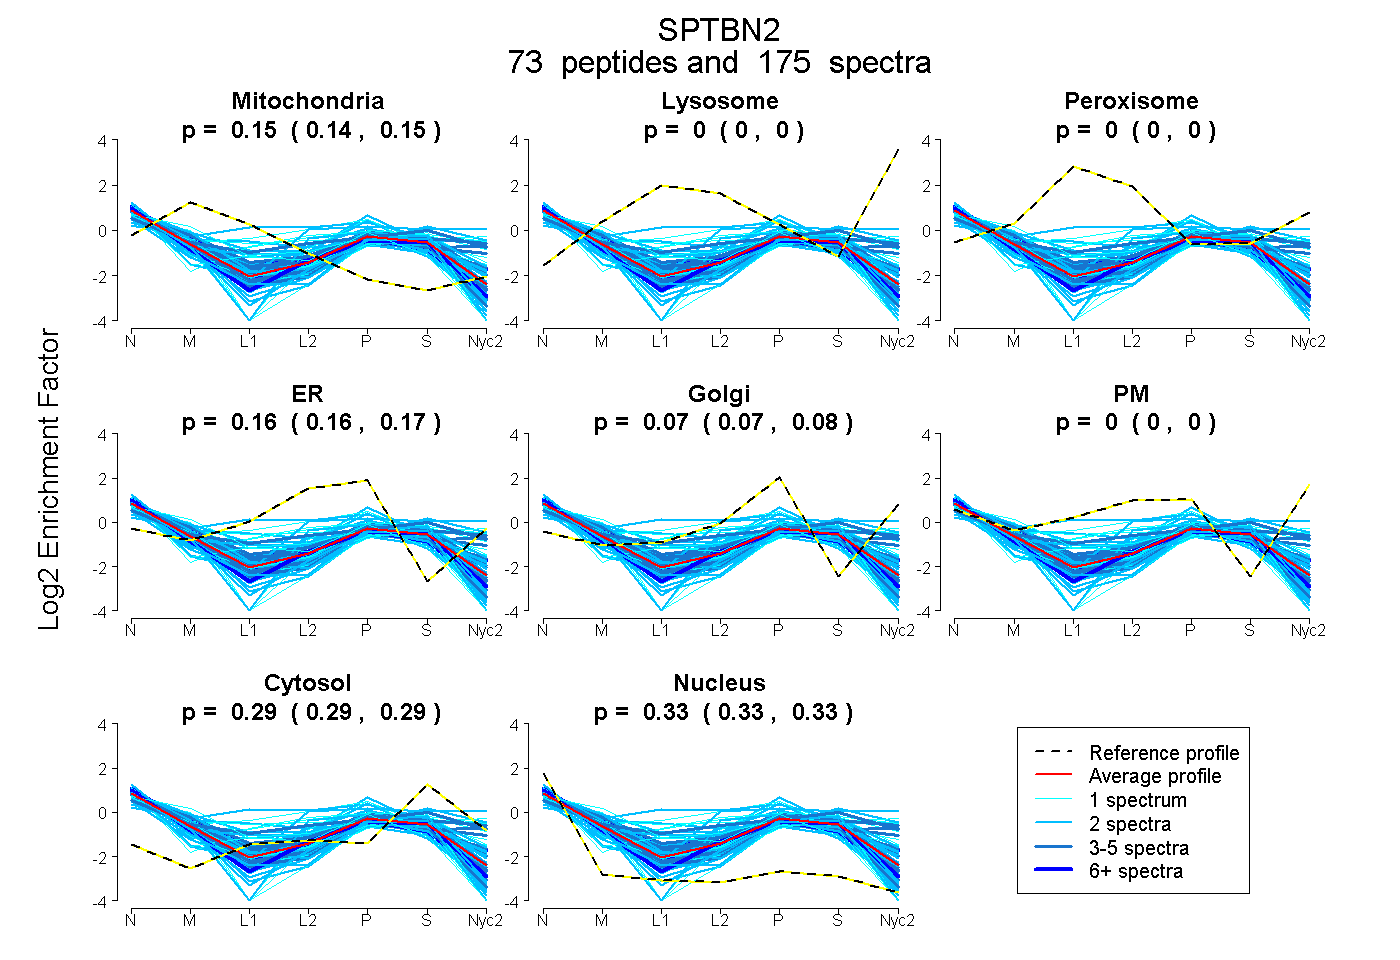
0.143 | 0.147
0.000 | 0.000
0.000 | 0.000
0.159 | 0.170
0.066 | 0.078
0.000 | 0.000
0.289 | 0.291
0.326 | 0.329
18peptides
spectra
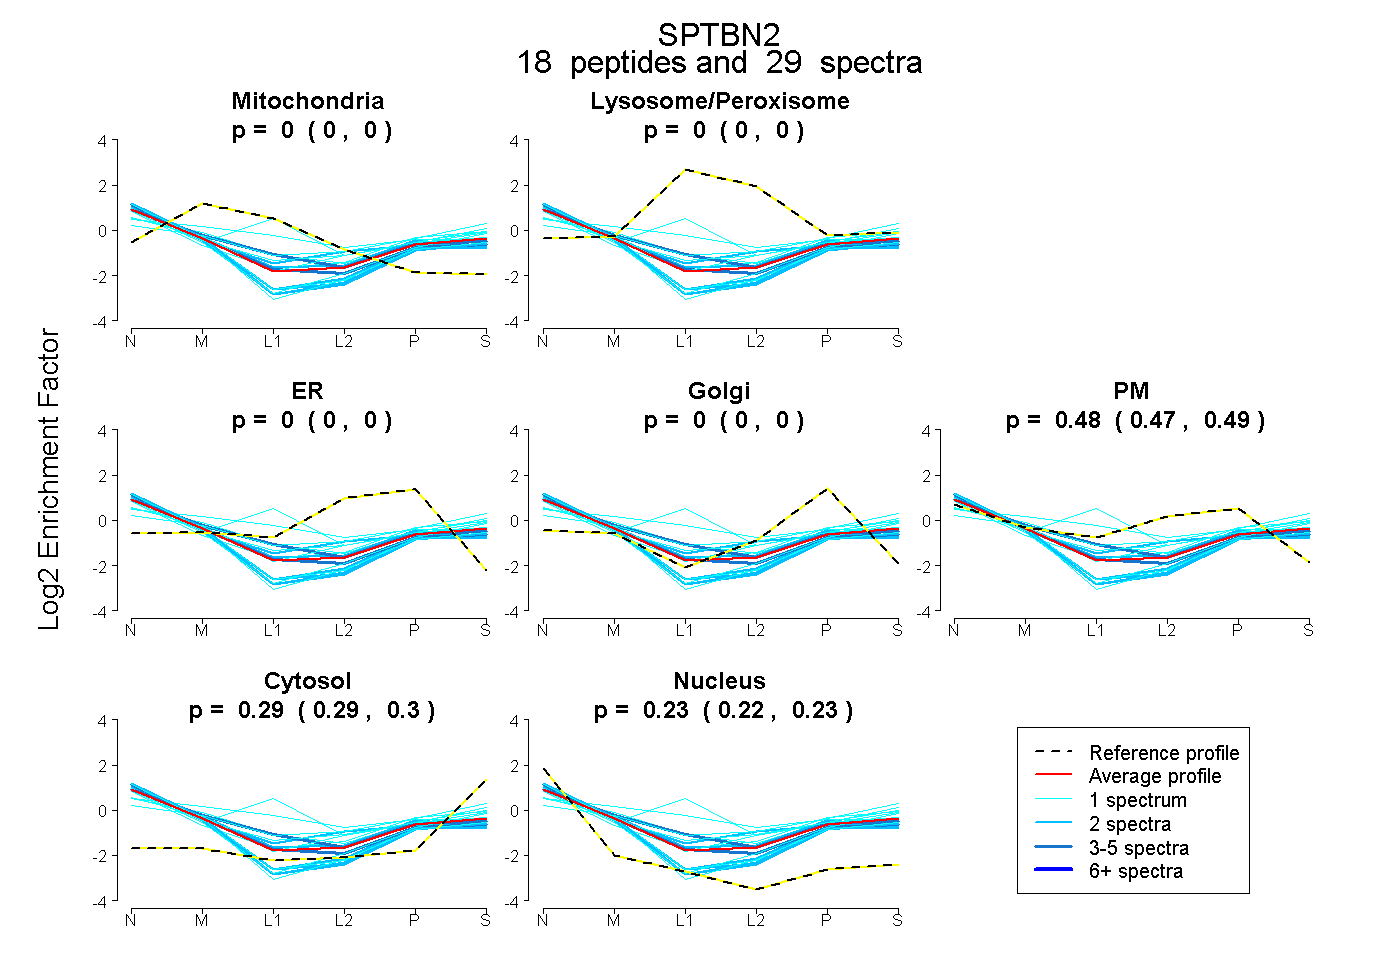
0.000 | 0.000
0.000 | 0.000
0.000 | 0.000
0.000 | 0.000
0.472 | 0.488
0.289 | 0.299
0.217 | 0.231
33peptides
spectra
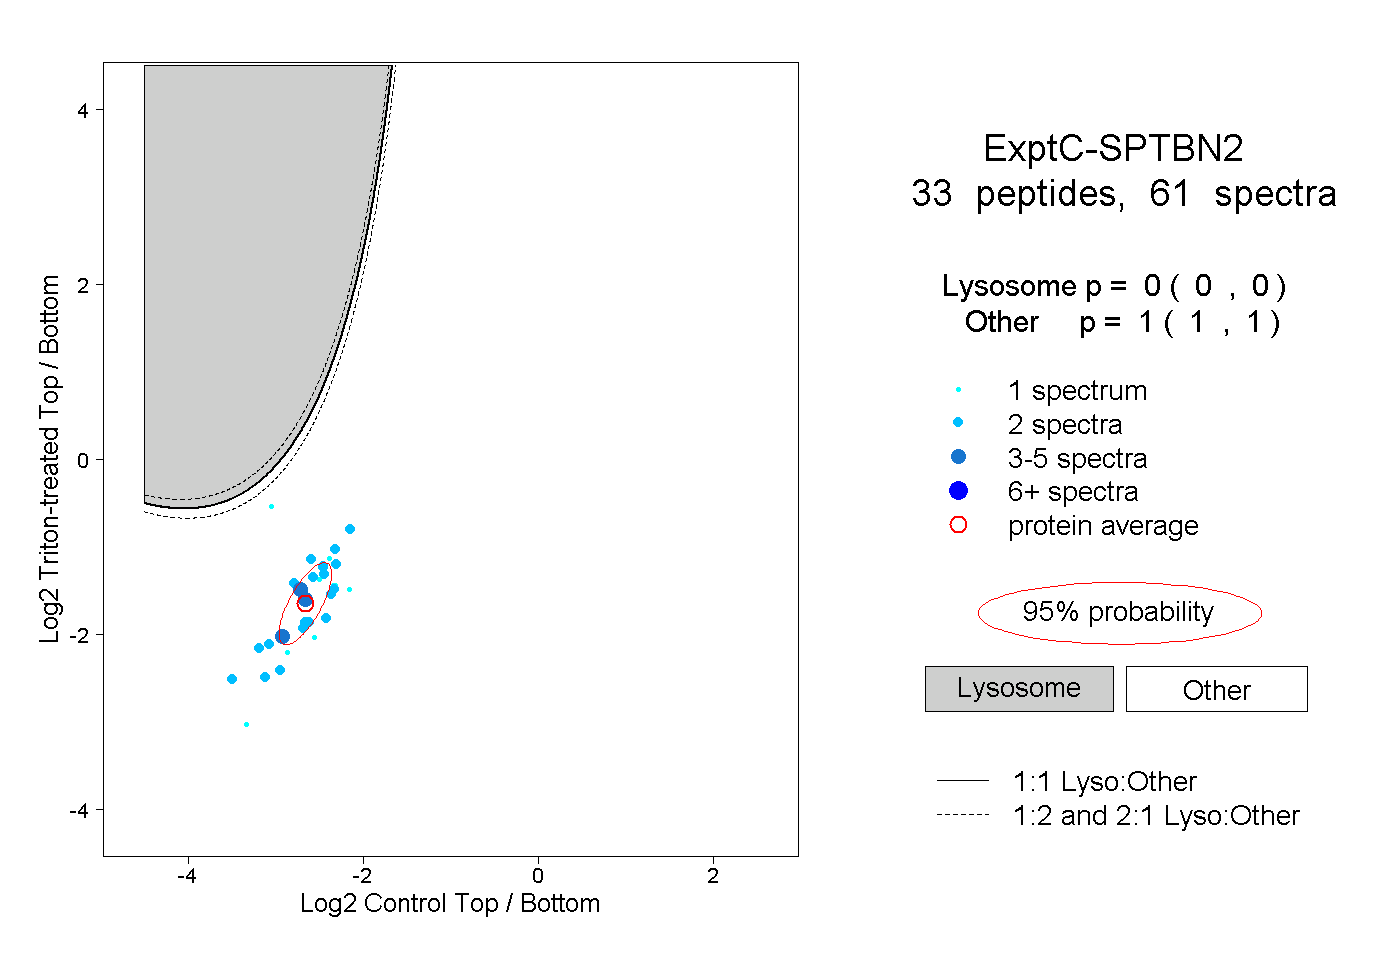
0.000 | 0.000
1.000 | 1.000