 4
4peptides
spectra
0.000 | 0.000
0.000 | 0.000
0.000 | 0.000
0.021 | 0.222
0.000 | 0.187
0.000 | 0.000
0.451 | 0.492
0.268 | 0.351
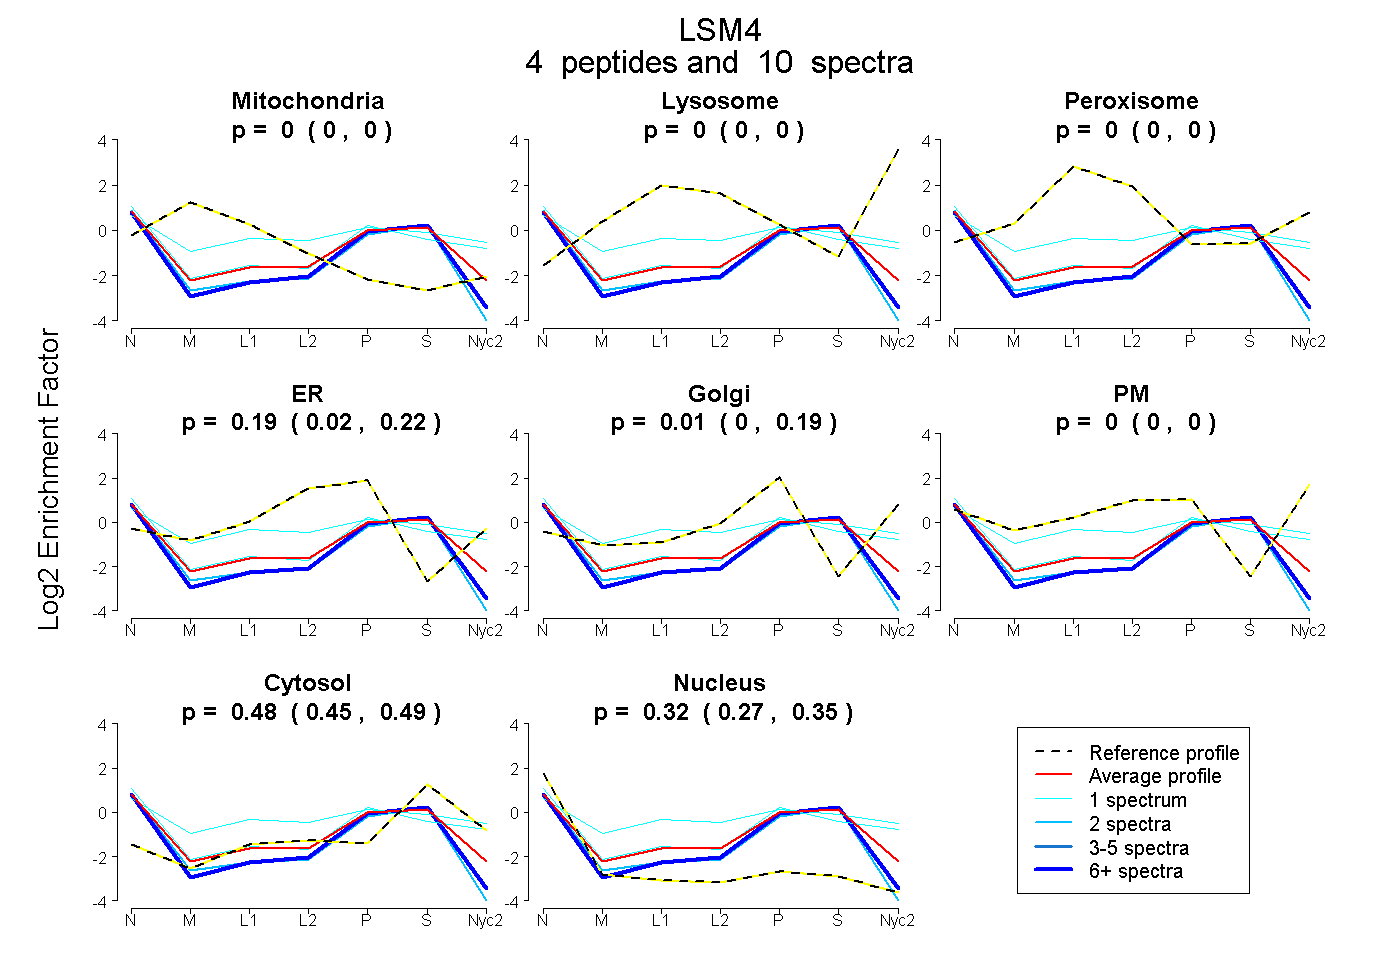
| Plot | Mito | Lyso | Perox | ER | Golgi | PM | Cytosol | Nucleus | |||||
| Expt A |
4 peptides |
10 spectra |
|
0.000 0.000 | 0.000 |
0.000 0.000 | 0.000 |
0.000 0.000 | 0.000 |
0.193 0.021 | 0.222 |
0.011 0.000 | 0.187 |
0.000 0.000 | 0.000 |
0.480 0.451 | 0.492 |
0.316 0.268 | 0.351 |
| 1 spectrum, MPECYIR | 0.000 | 0.000 | 0.162 | 0.050 | 0.009 | 0.289 | 0.360 | 0.130 | ||
| 2 spectra, EVICTSR | 0.000 | 0.000 | 0.000 | 0.052 | 0.000 | 0.000 | 0.445 | 0.503 | ||
| 6 spectra, IPDEIIDMVR | 0.000 | 0.000 | 0.000 | 0.065 | 0.000 | 0.000 | 0.481 | 0.454 | ||
| 1 spectrum, TAQNHPMLVELK | 0.000 | 0.000 | 0.000 | 0.000 | 0.301 | 0.076 | 0.358 | 0.265 |
| Plot | Mito | Lyso or Perox | ER | Golgi | PM | Cytosol | Nucleus | ||||||
| Expt B |
1 peptide |
1 spectrum |
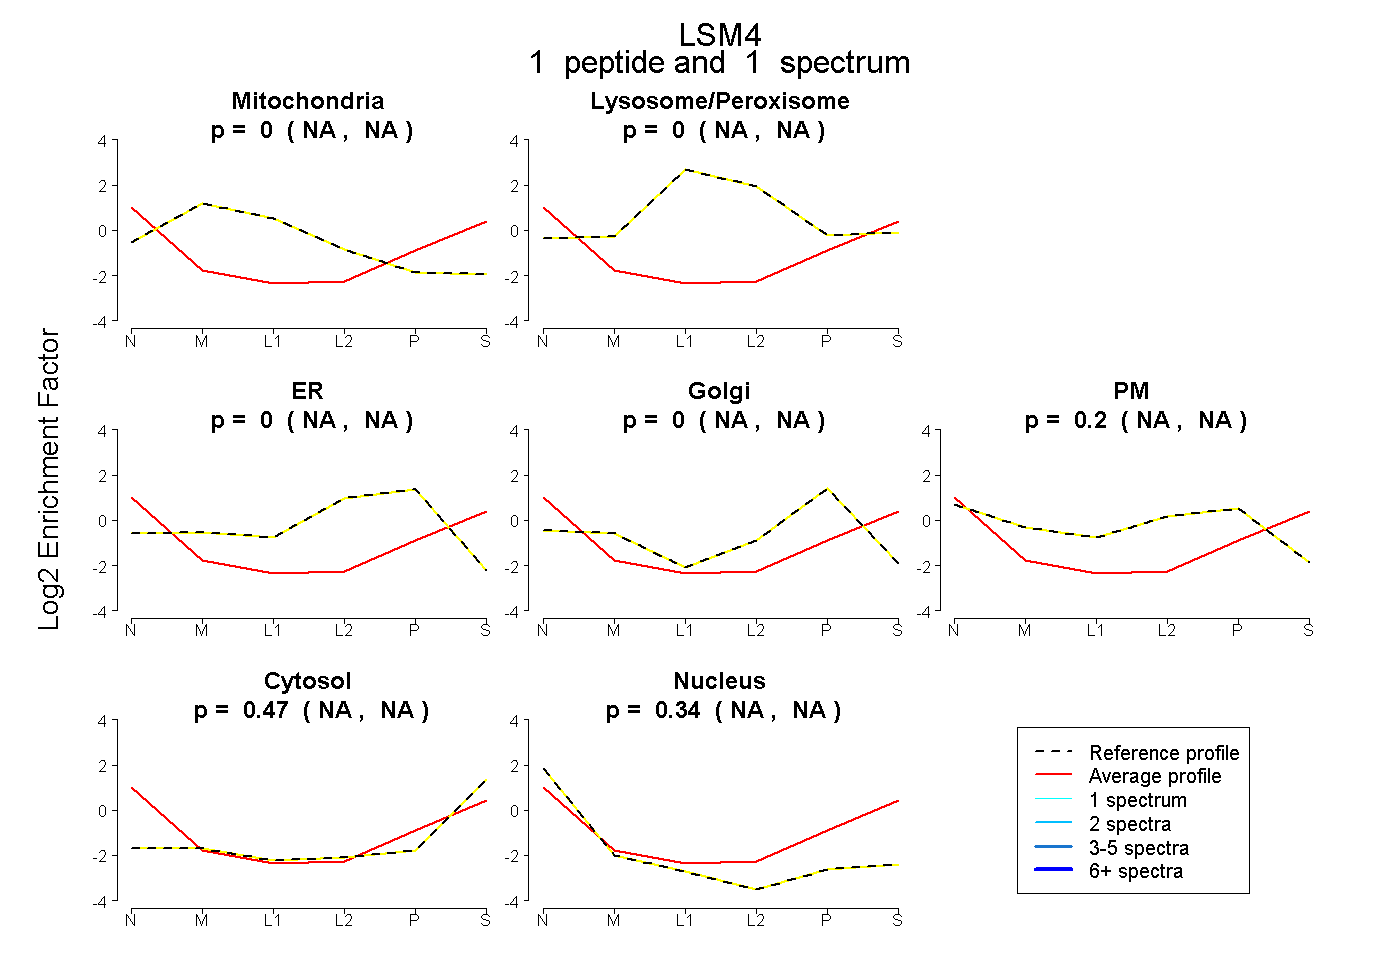 |
0.000 NA | NA |
0.000 NA | NA |
0.000 NA | NA |
0.000 NA | NA |
0.198 NA | NA |
0.467 NA | NA |
0.335 NA | NA |
|||
| Plot | Lyso | Other | |||||||||||
| Expt C |
2 peptides |
3 spectra |
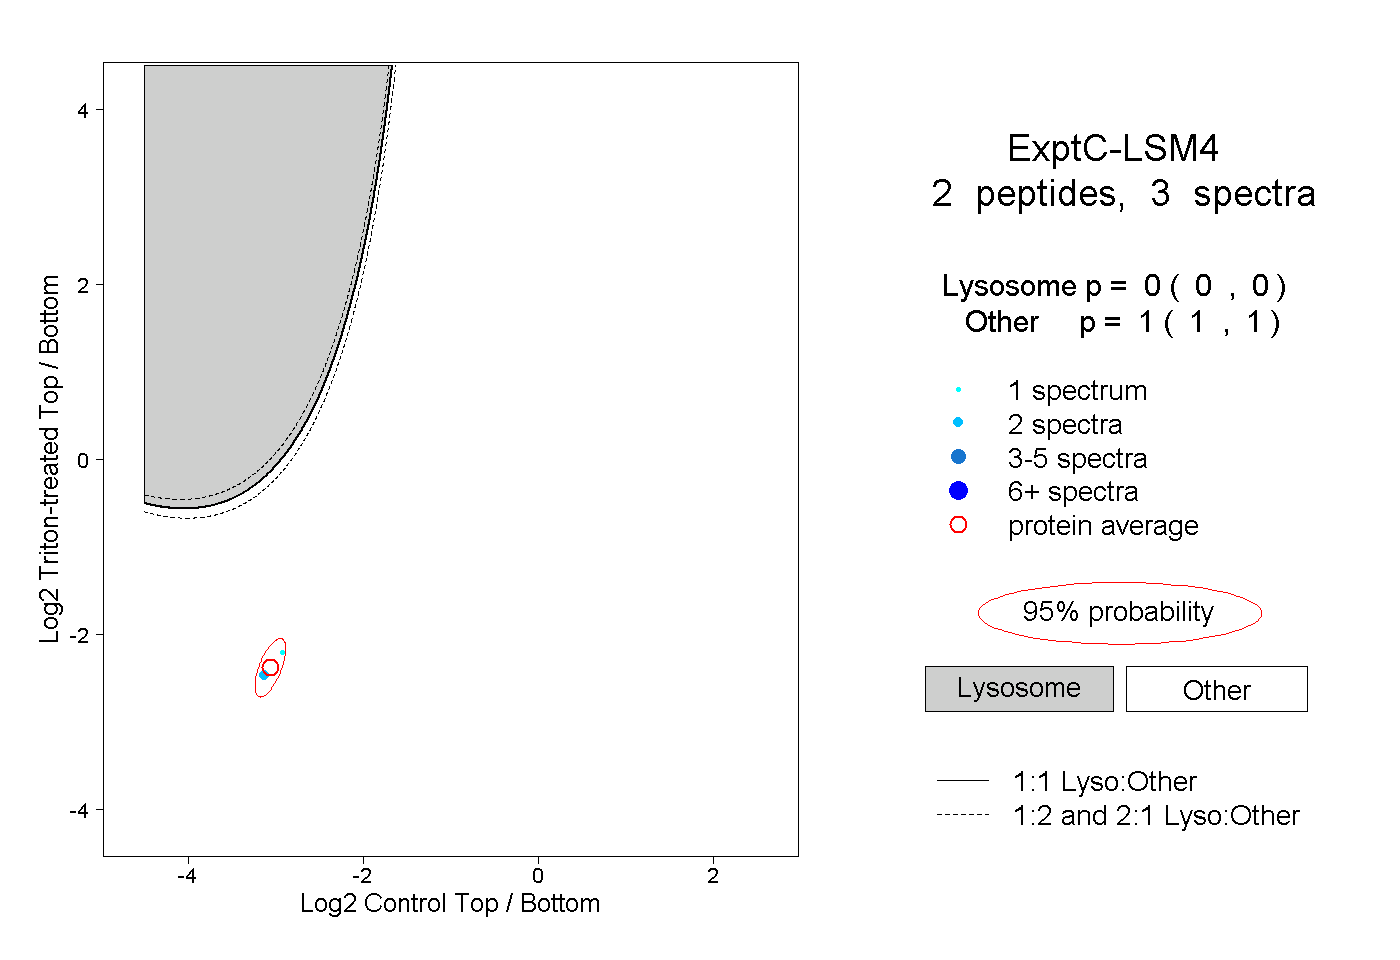 |
0.000 0.000 | 0.000 |
1.000 1.000 | 1.000 |