 8
8peptides
spectra
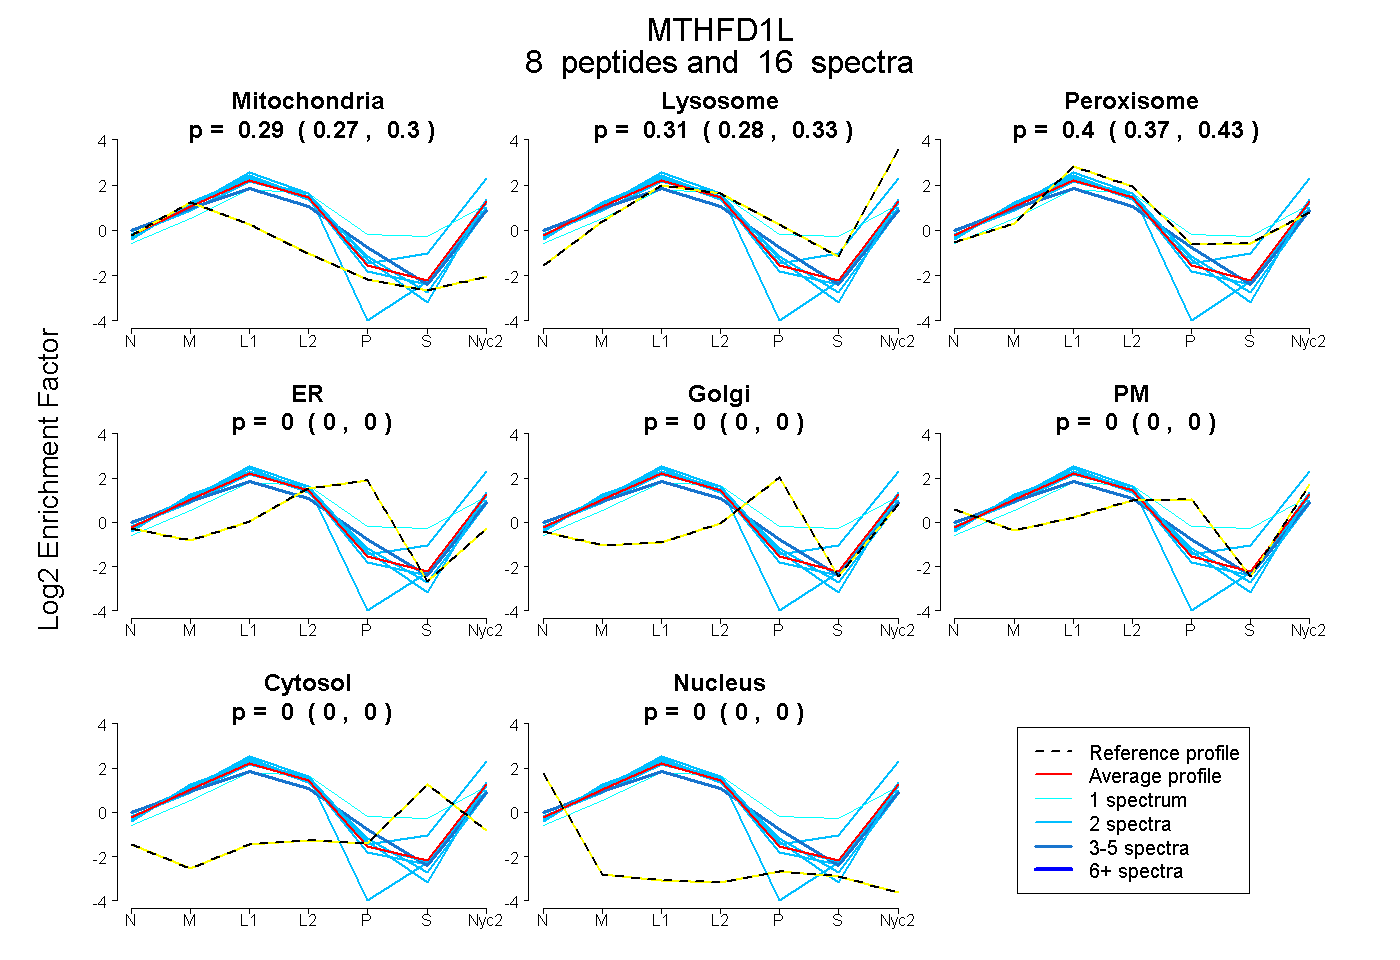
0.274 | 0.302
0.284 | 0.333
0.369 | 0.426
0.000 | 0.000
0.000 | 0.000
0.000 | 0.000
0.000 | 0.000
0.000 | 0.000
1peptide
spectrum
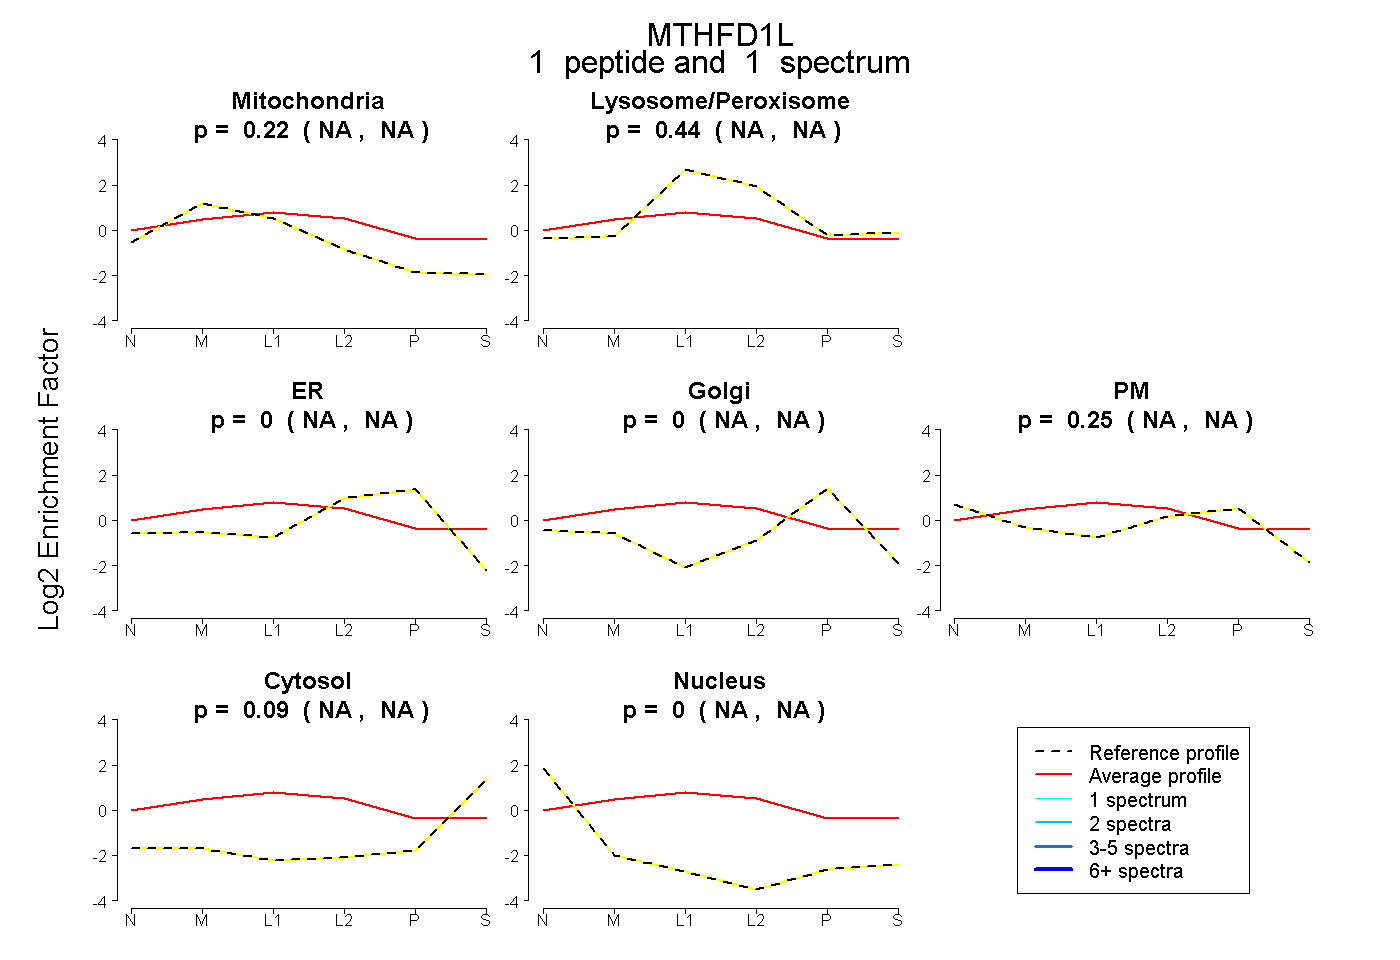
NA | NA
NA | NA
NA | NA
NA | NA
NA | NA
NA | NA
NA | NA
24peptides
spectra
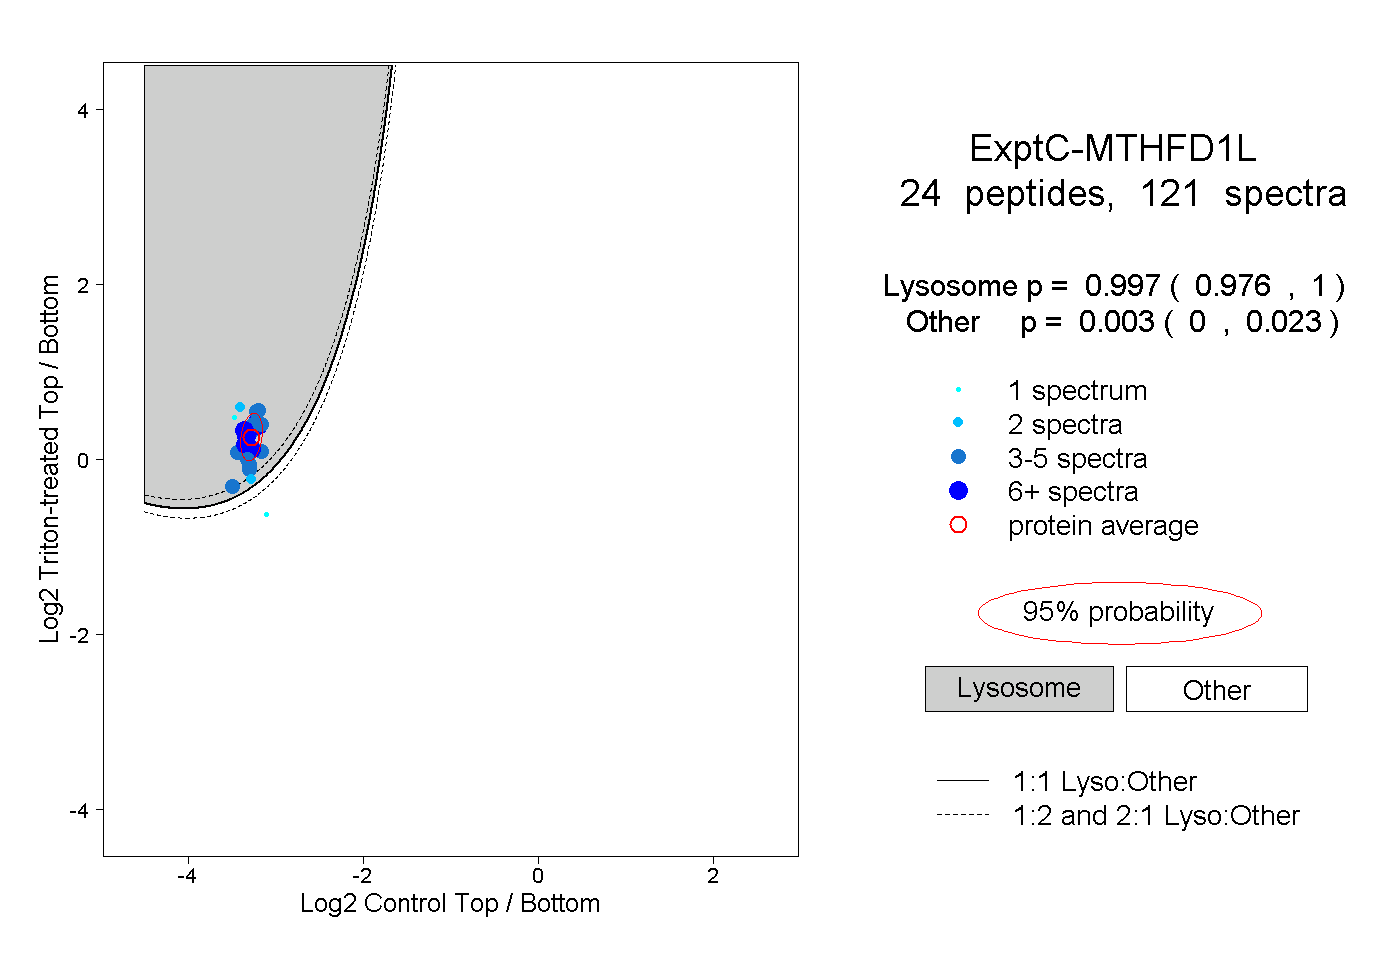
0.976 | 1.000
0.000 | 0.023
9peptides
spectra
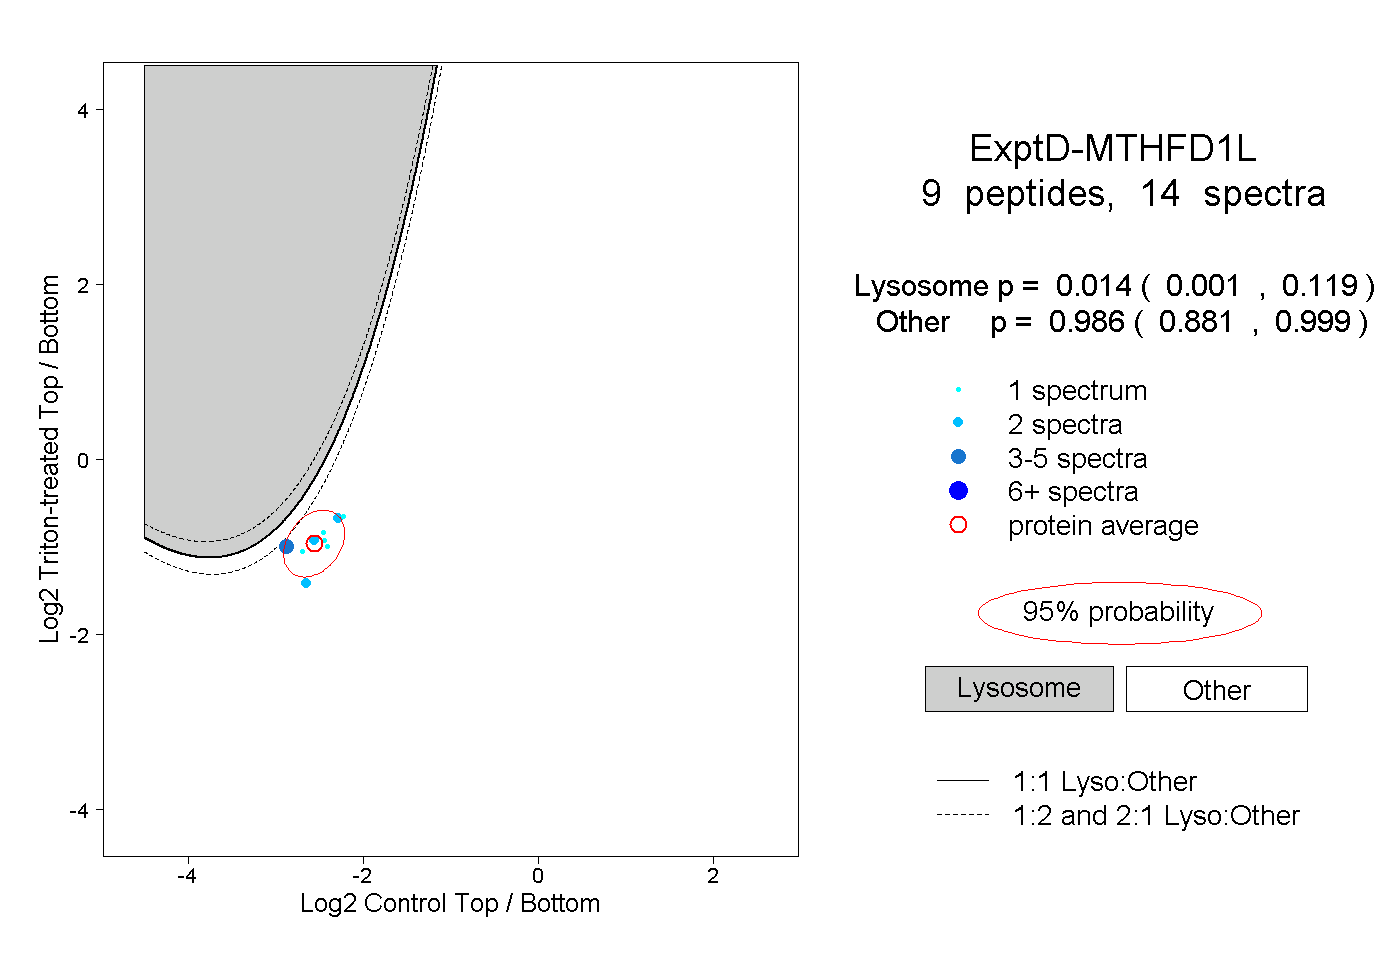
0.001 | 0.119
0.881 | 0.999