 3
3peptides
spectra
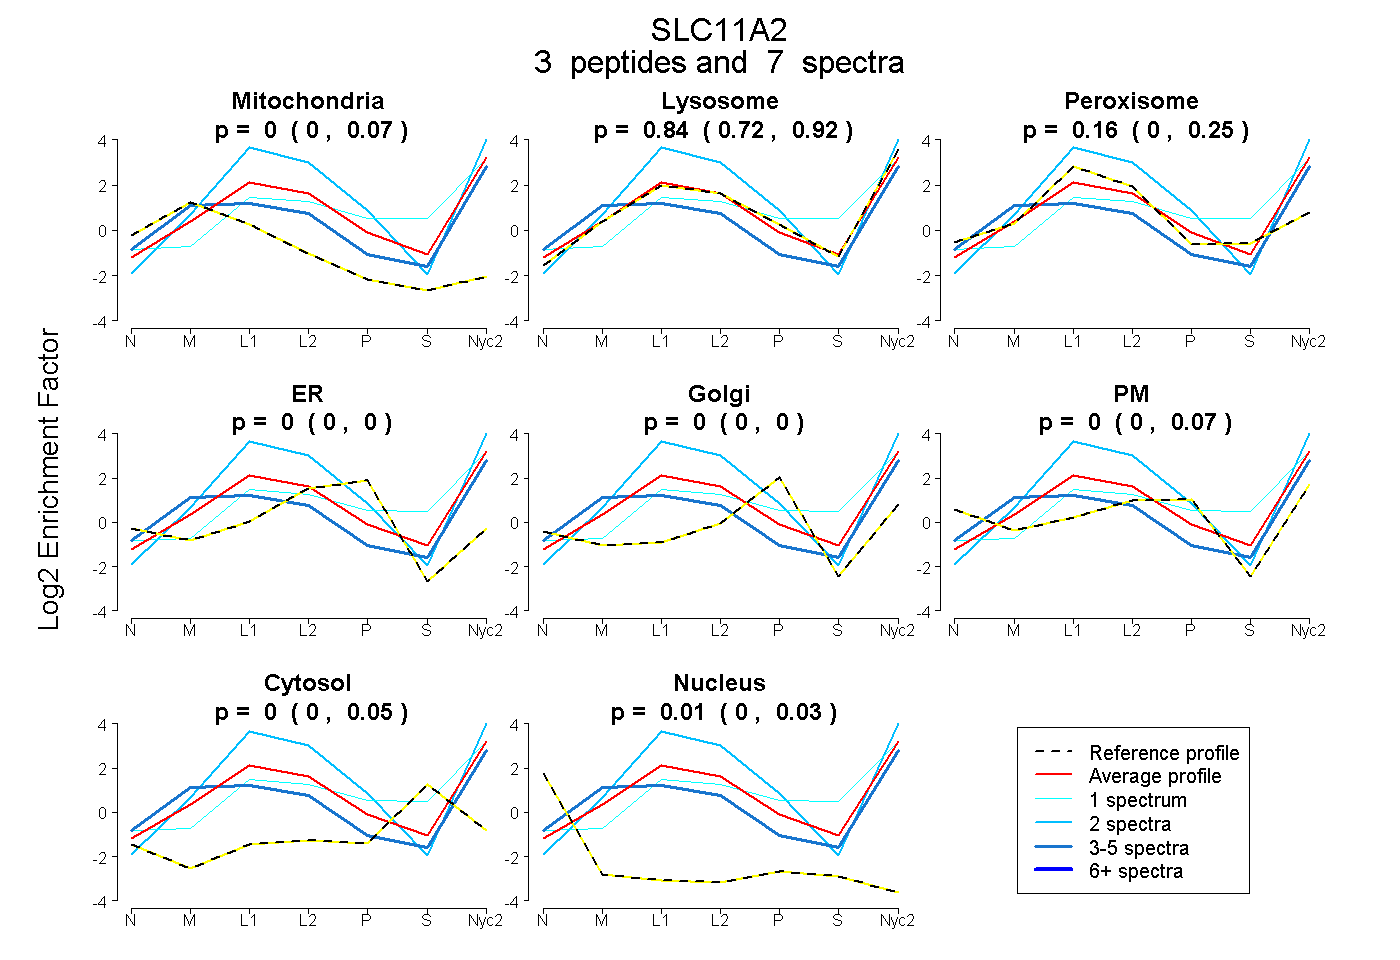
0.000 | 0.066
0.720 | 0.921
0.000 | 0.247
0.000 | 0.000
0.000 | 0.000
0.000 | 0.073
0.000 | 0.053
0.000 | 0.033
1peptide
spectrum
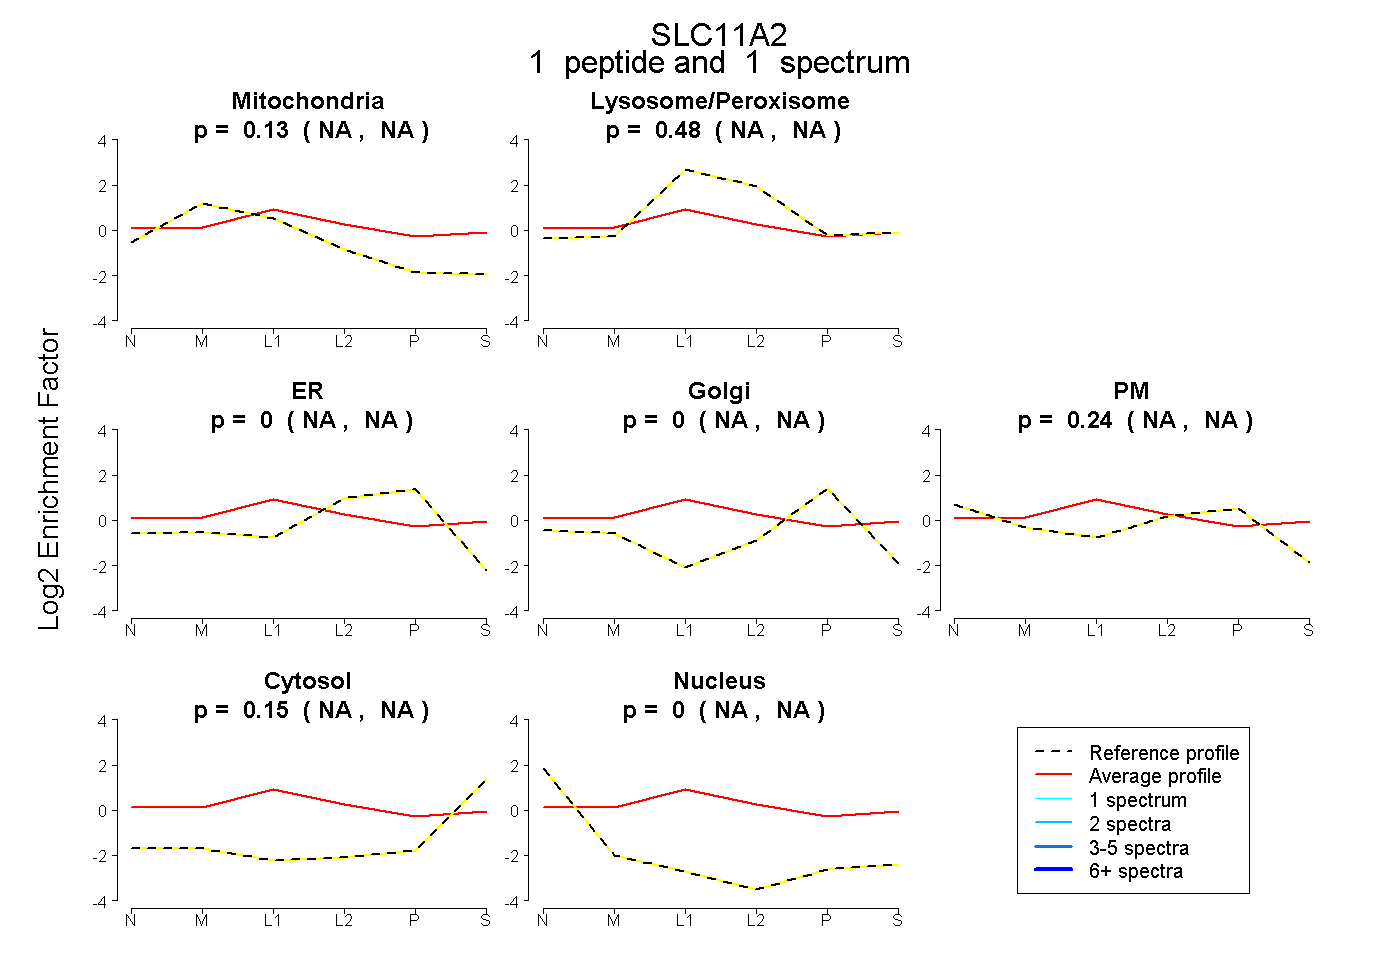
NA | NA
NA | NA
NA | NA
NA | NA
NA | NA
NA | NA
NA | NA
3peptides
spectra

1.000 | 1.000
0.000 | 0.000
1peptide
spectrum
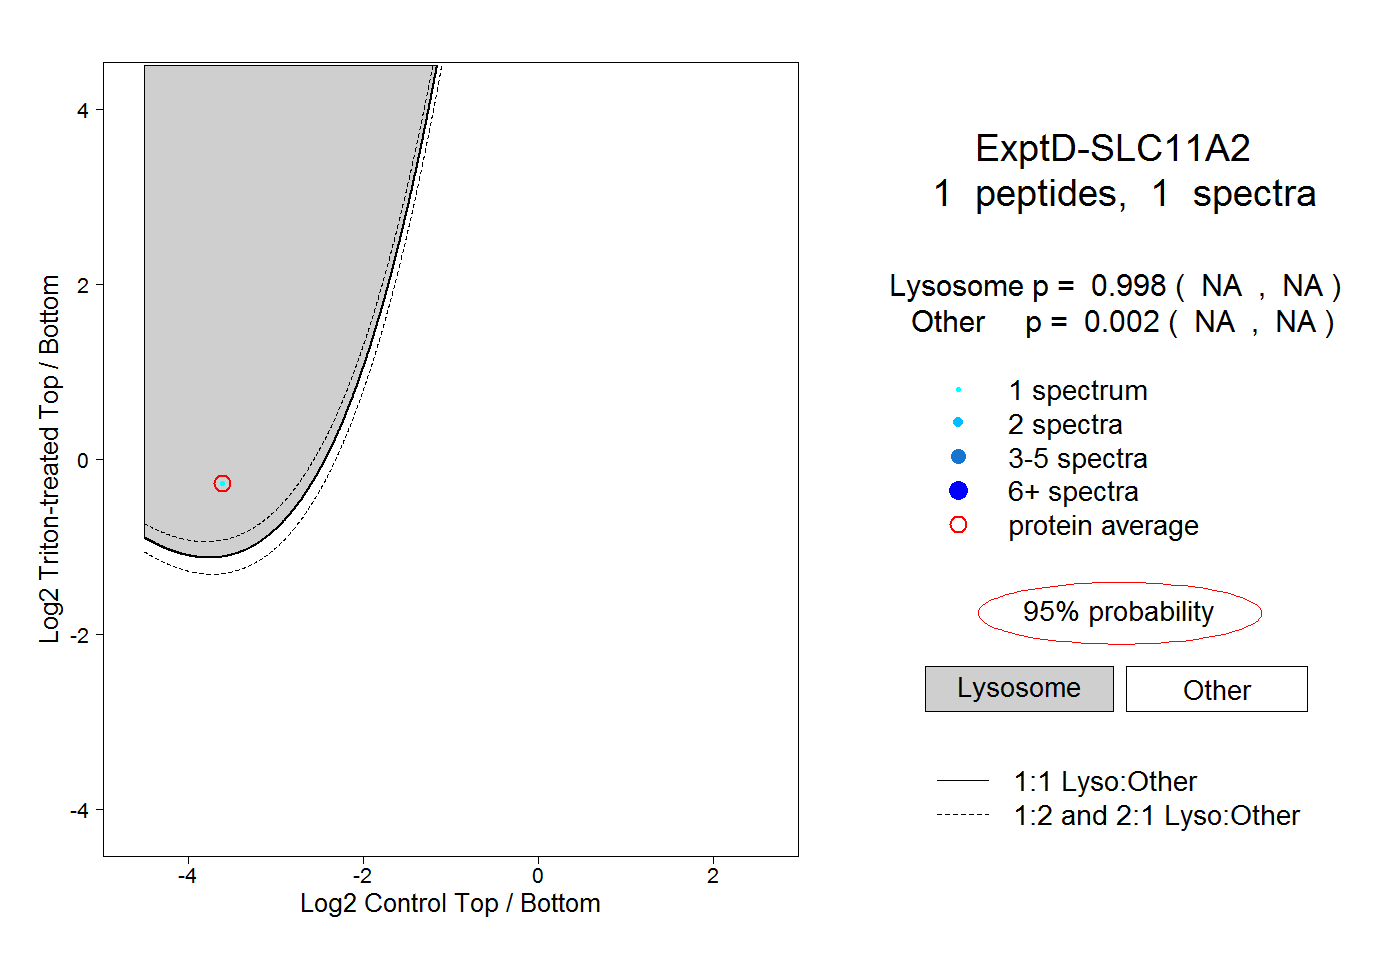
NA | NA
NA | NA