7
7peptides
spectra
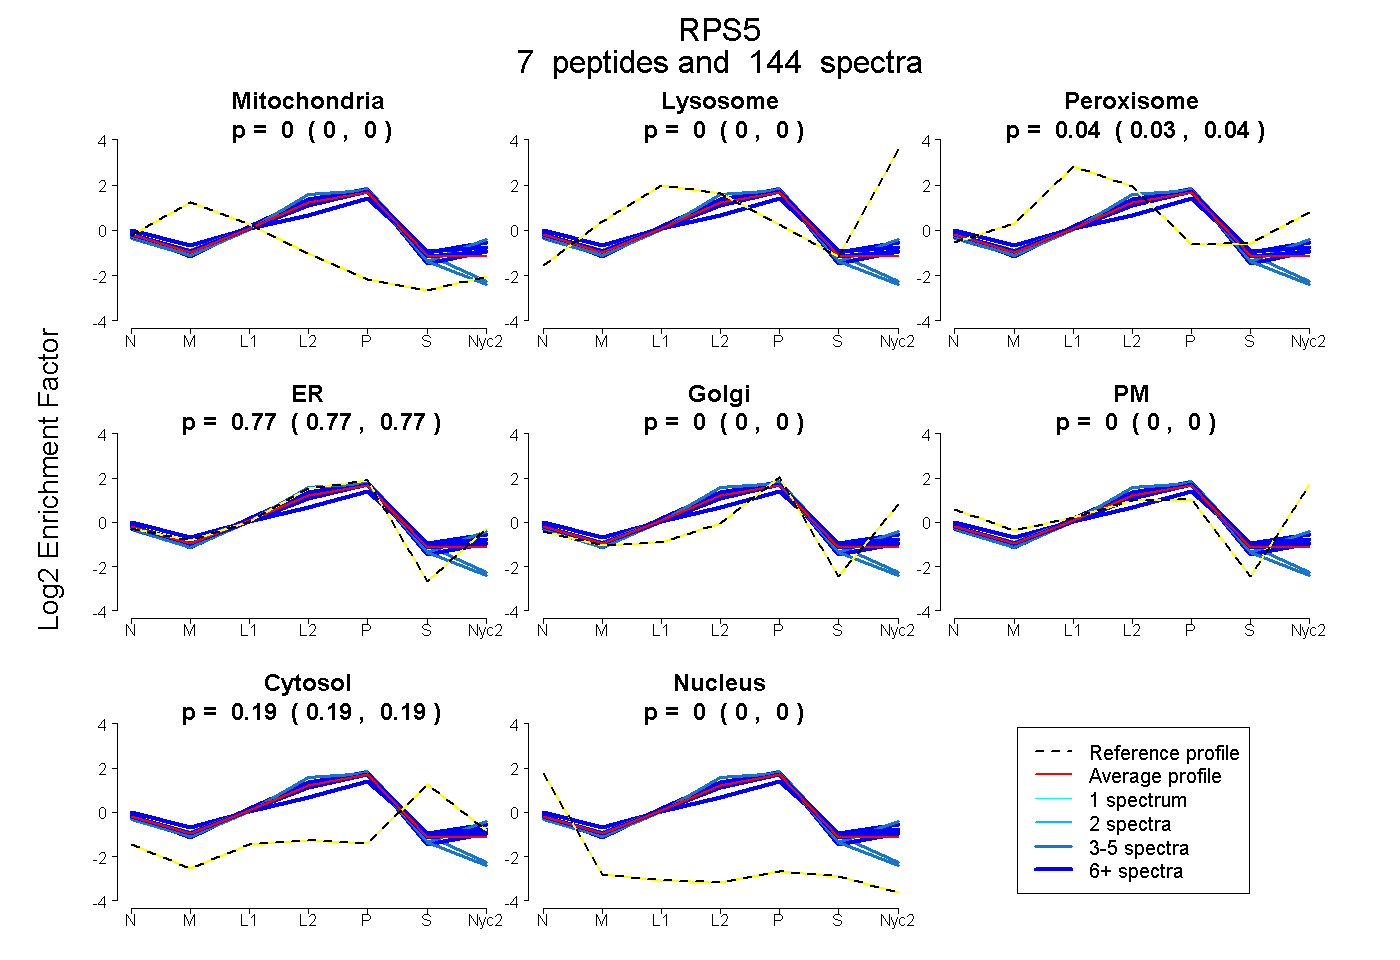
0.000 | 0.000
0.000 | 0.000
0.035 | 0.042
0.767 | 0.772
0.000 | 0.000
0.000 | 0.000
0.189 | 0.194
0.000 | 0.000
7peptides
spectra
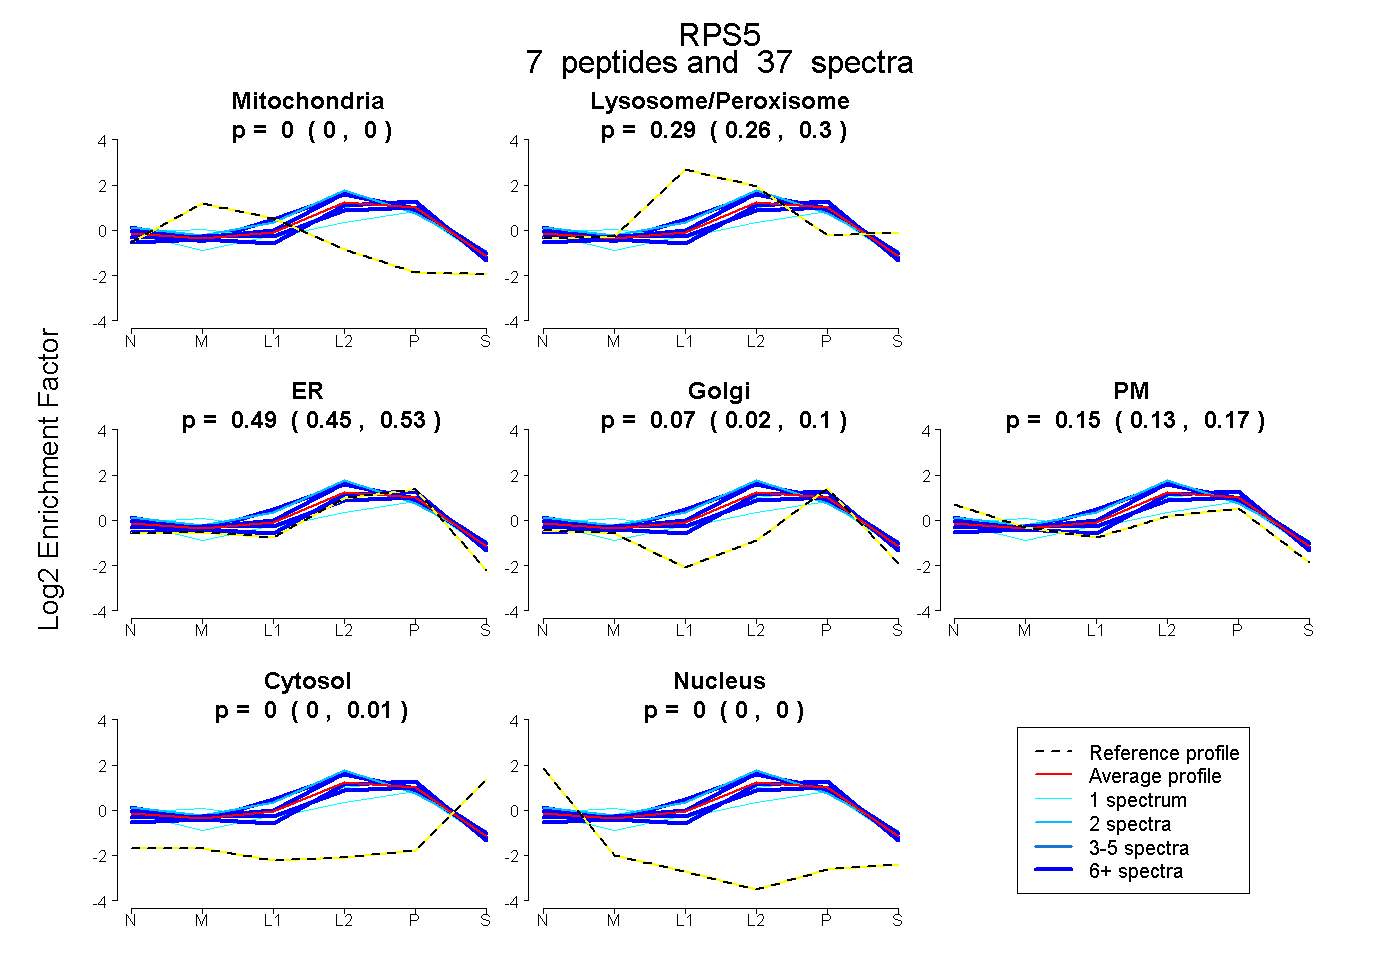
0.000 | 0.000
0.265 | 0.297
0.452 | 0.528
0.022 | 0.101
0.130 | 0.174
0.000 | 0.010
0.000 | 0.000