 7
7peptides
spectra
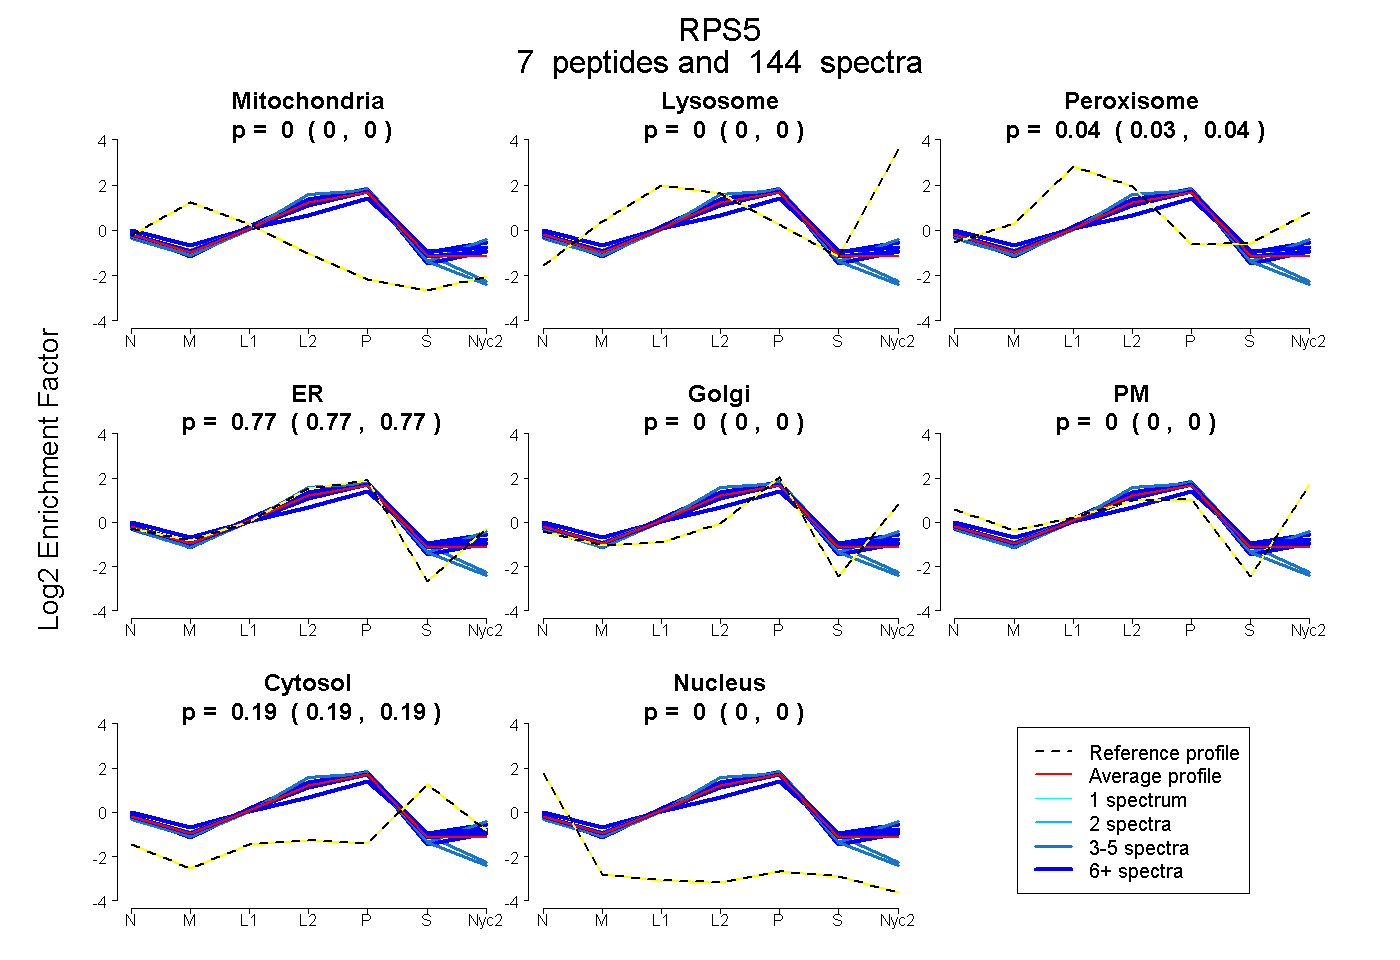
0.000 | 0.000
0.000 | 0.000
0.035 | 0.042
0.767 | 0.772
0.000 | 0.000
0.000 | 0.000
0.189 | 0.194
0.000 | 0.000
| Plot | Mito | Lyso | Perox | ER | Golgi | PM | Cytosol | Nucleus | |||||
| Expt A |
7 peptides |
144 spectra |
|
0.000 0.000 | 0.000 |
0.000 0.000 | 0.000 |
0.039 0.035 | 0.042 |
0.770 0.767 | 0.772 |
0.000 0.000 | 0.000 |
0.000 0.000 | 0.000 |
0.192 0.189 | 0.194 |
0.000 0.000 | 0.000 |
| 5 spectra, QAVDVSPLR | 0.000 | 0.000 | 0.080 | 0.792 | 0.000 | 0.000 | 0.128 | 0.000 | ||
| 7 spectra, GSSNSYAIK | 0.000 | 0.000 | 0.022 | 0.833 | 0.000 | 0.000 | 0.146 | 0.000 | ||
| 64 spectra, LTNSMMMHGR | 0.000 | 0.000 | 0.115 | 0.613 | 0.052 | 0.000 | 0.220 | 0.000 | ||
| 50 spectra, YLPHSAGR | 0.000 | 0.000 | 0.042 | 0.763 | 0.000 | 0.000 | 0.195 | 0.000 | ||
| 8 spectra, TIAECLADELINAAK | 0.000 | 0.000 | 0.085 | 0.728 | 0.000 | 0.000 | 0.187 | 0.000 | ||
| 5 spectra, VNQAIWLLCTGAR | 0.000 | 0.000 | 0.000 | 0.819 | 0.000 | 0.000 | 0.135 | 0.046 | ||
| 5 spectra, AQCPIVER | 0.000 | 0.000 | 0.000 | 0.790 | 0.000 | 0.000 | 0.200 | 0.010 |
| Plot | Mito | Lyso or Perox | ER | Golgi | PM | Cytosol | Nucleus | ||||||
| Expt B |
7 peptides |
37 spectra |
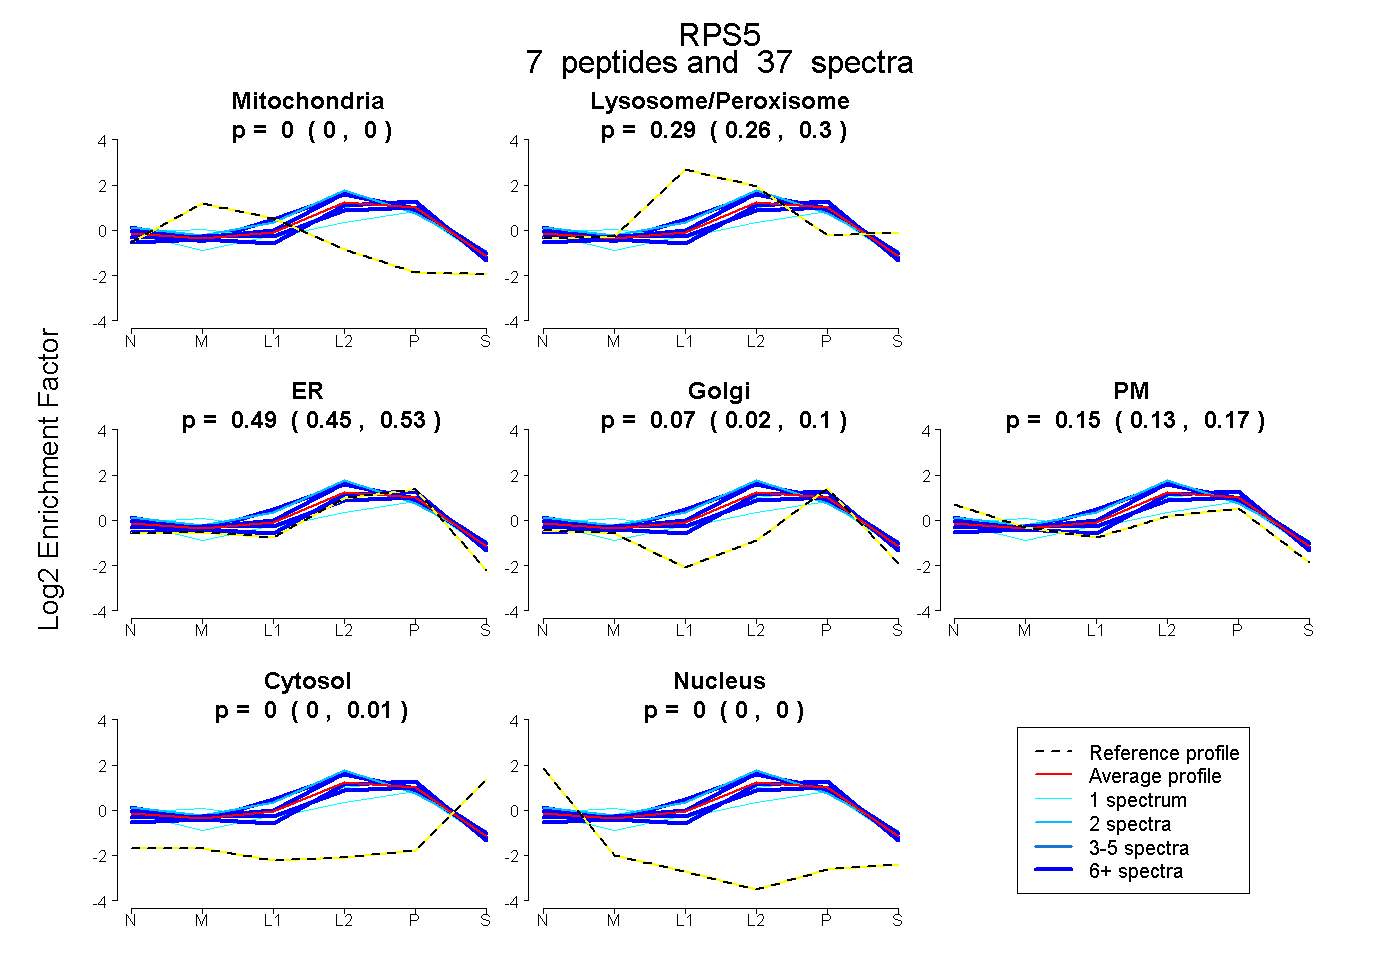 |
0.000 0.000 | 0.000 |
0.287 0.265 | 0.297 |
0.486 0.452 | 0.528 |
0.075 0.022 | 0.101 |
0.151 0.130 | 0.174 |
0.001 0.000 | 0.010 |
0.000 0.000 | 0.000 |
|||
| Plot | Lyso | Other | |||||||||||
| Expt C |
7 peptides |
150 spectra |
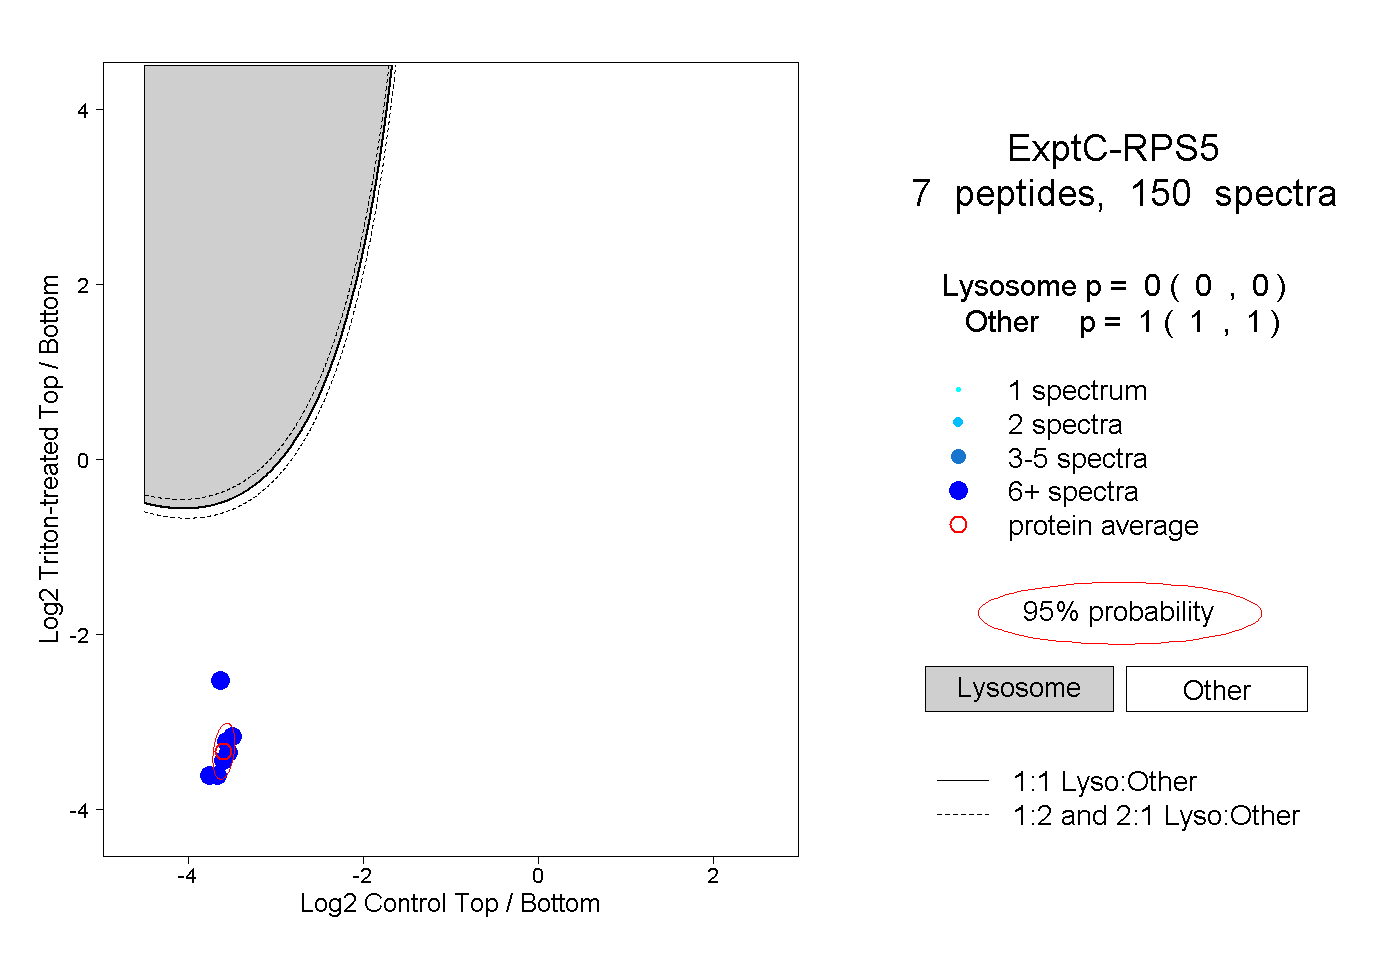 |
0.000 0.000 | 0.000 |
1.000 1.000 | 1.000 |
||||||||
| Plot | Lyso | Other | |||||||||||
| Expt D |
3 peptides |
5 spectra |
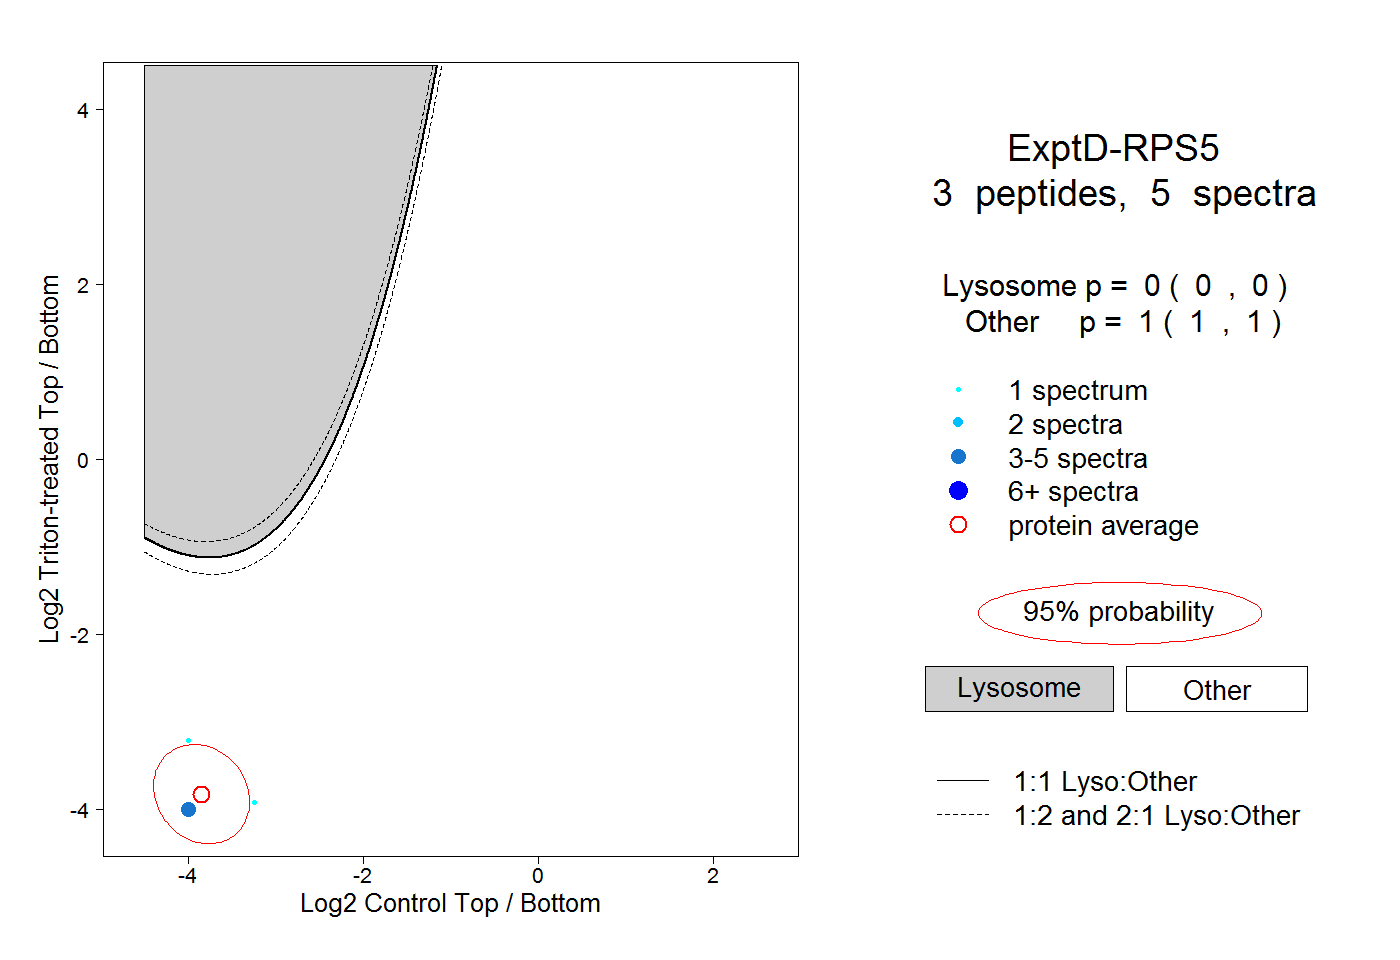 |
0.000 0.000 | 0.000 |
1.000 1.000 | 1.000 |