 5
5peptides
spectra
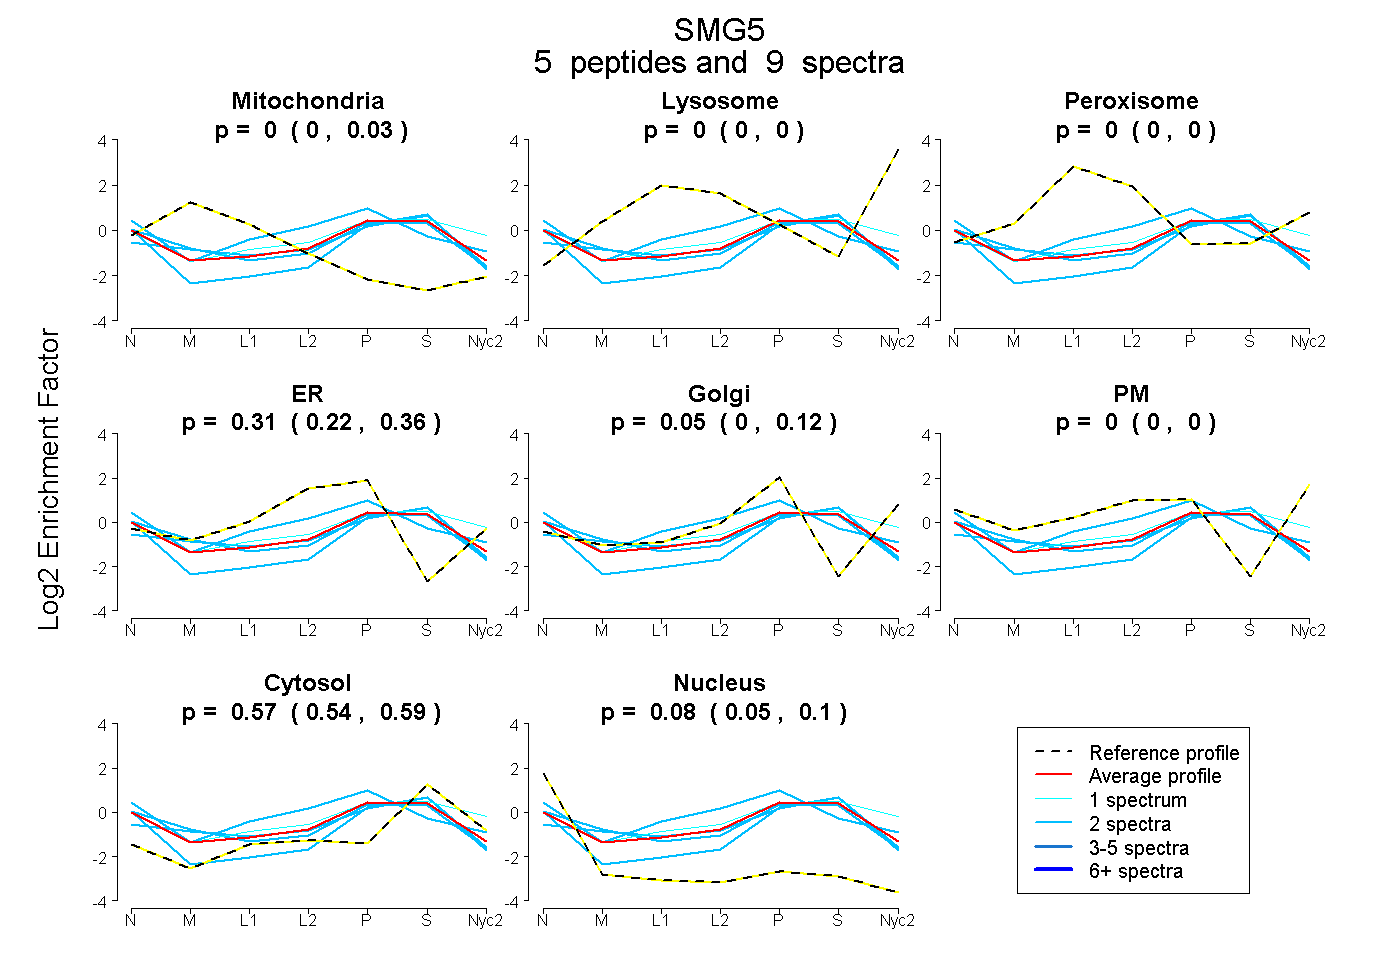
0.000 | 0.028
0.000 | 0.000
0.000 | 0.000
0.216 | 0.358
0.000 | 0.123
0.000 | 0.000
0.538 | 0.586
0.055 | 0.097
1peptide
spectrum
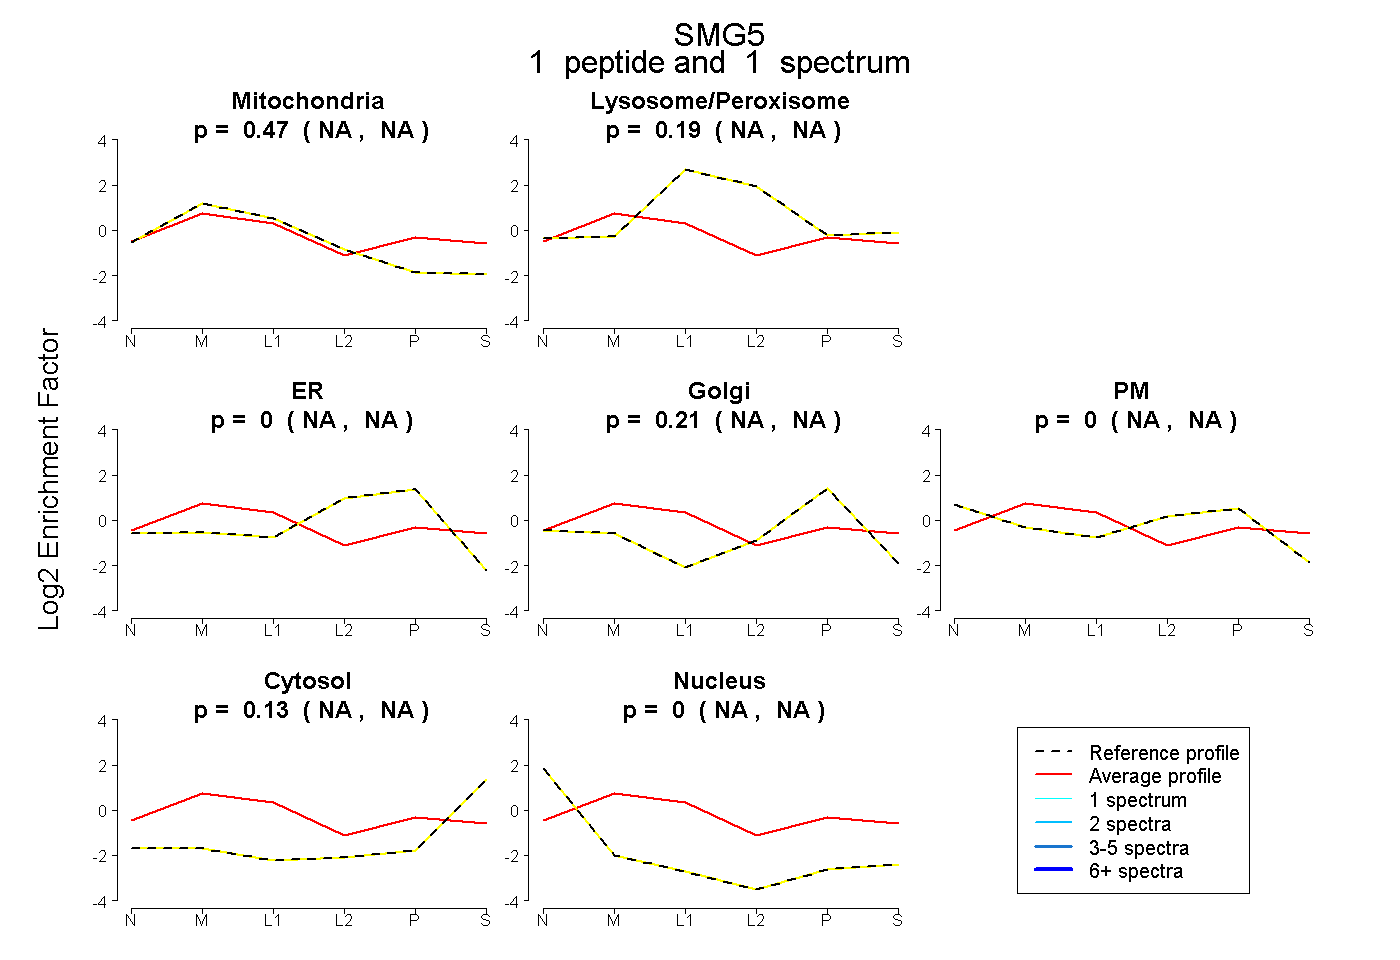
NA | NA
NA | NA
NA | NA
NA | NA
NA | NA
NA | NA
NA | NA
2peptides
spectra
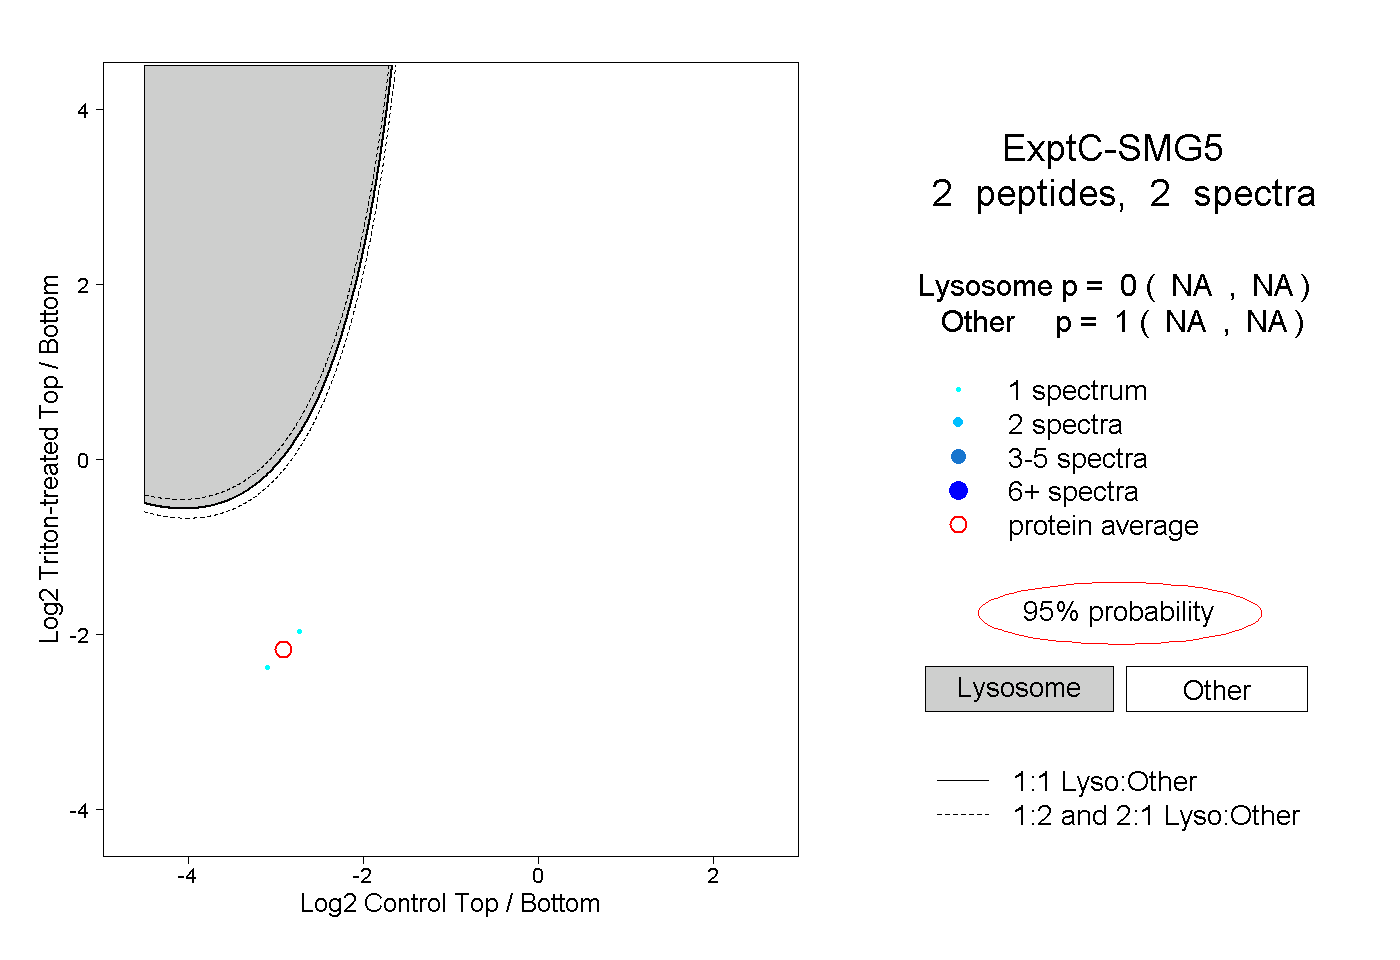
NA | NA
NA | NA