 2
2peptides
spectra
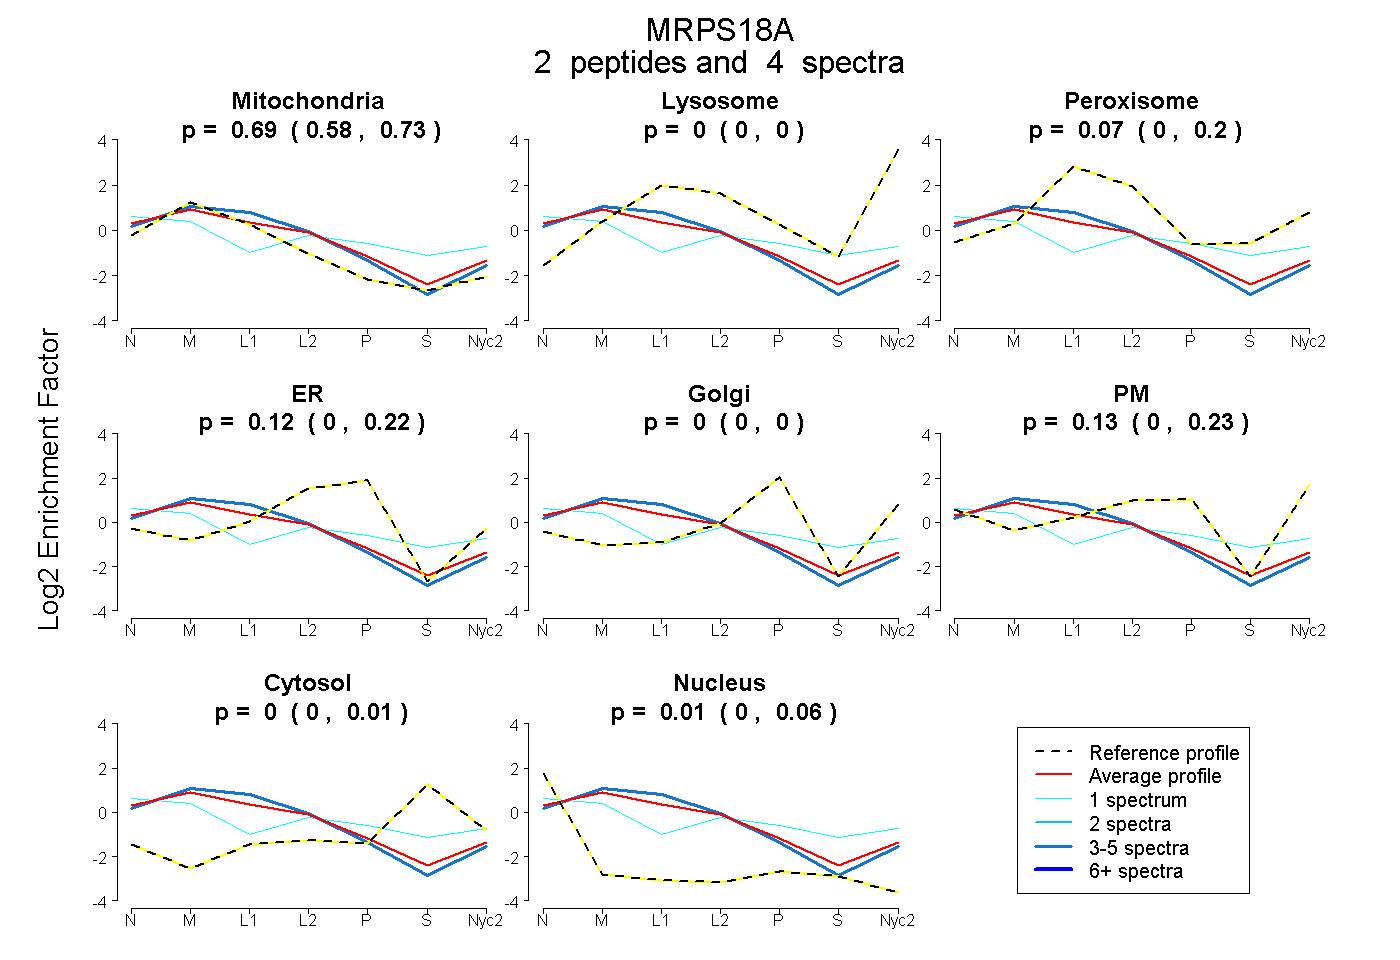
0.580 | 0.731
0.000 | 0.000
0.000 | 0.205
0.000 | 0.216
0.000 | 0.000
0.000 | 0.234
0.000 | 0.006
0.000 | 0.056
1peptide
spectra
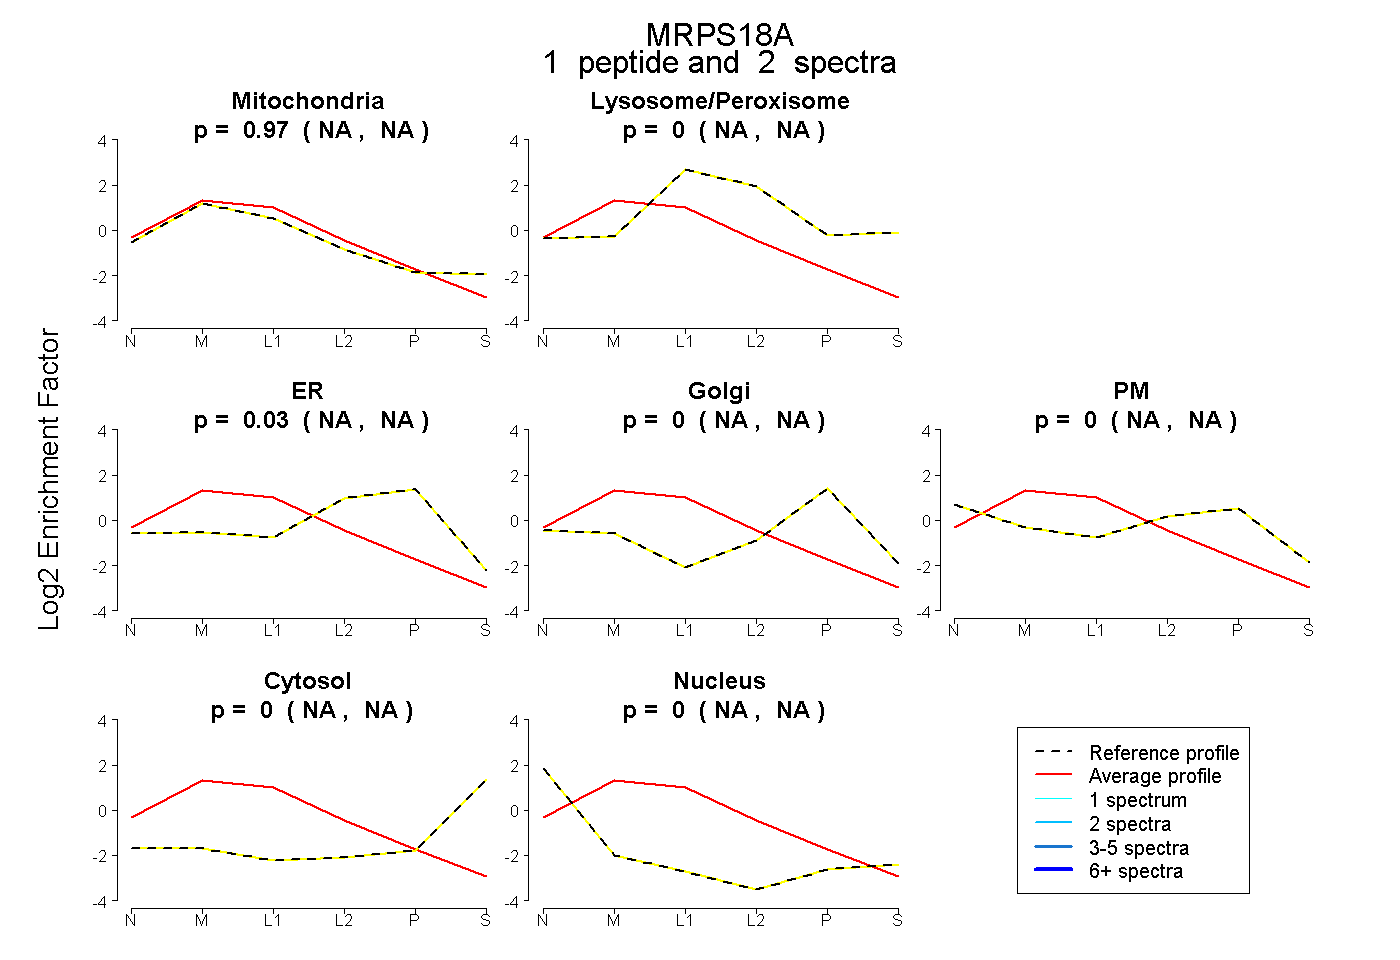
NA | NA
NA | NA
NA | NA
NA | NA
NA | NA
NA | NA
NA | NA
7peptides
spectra
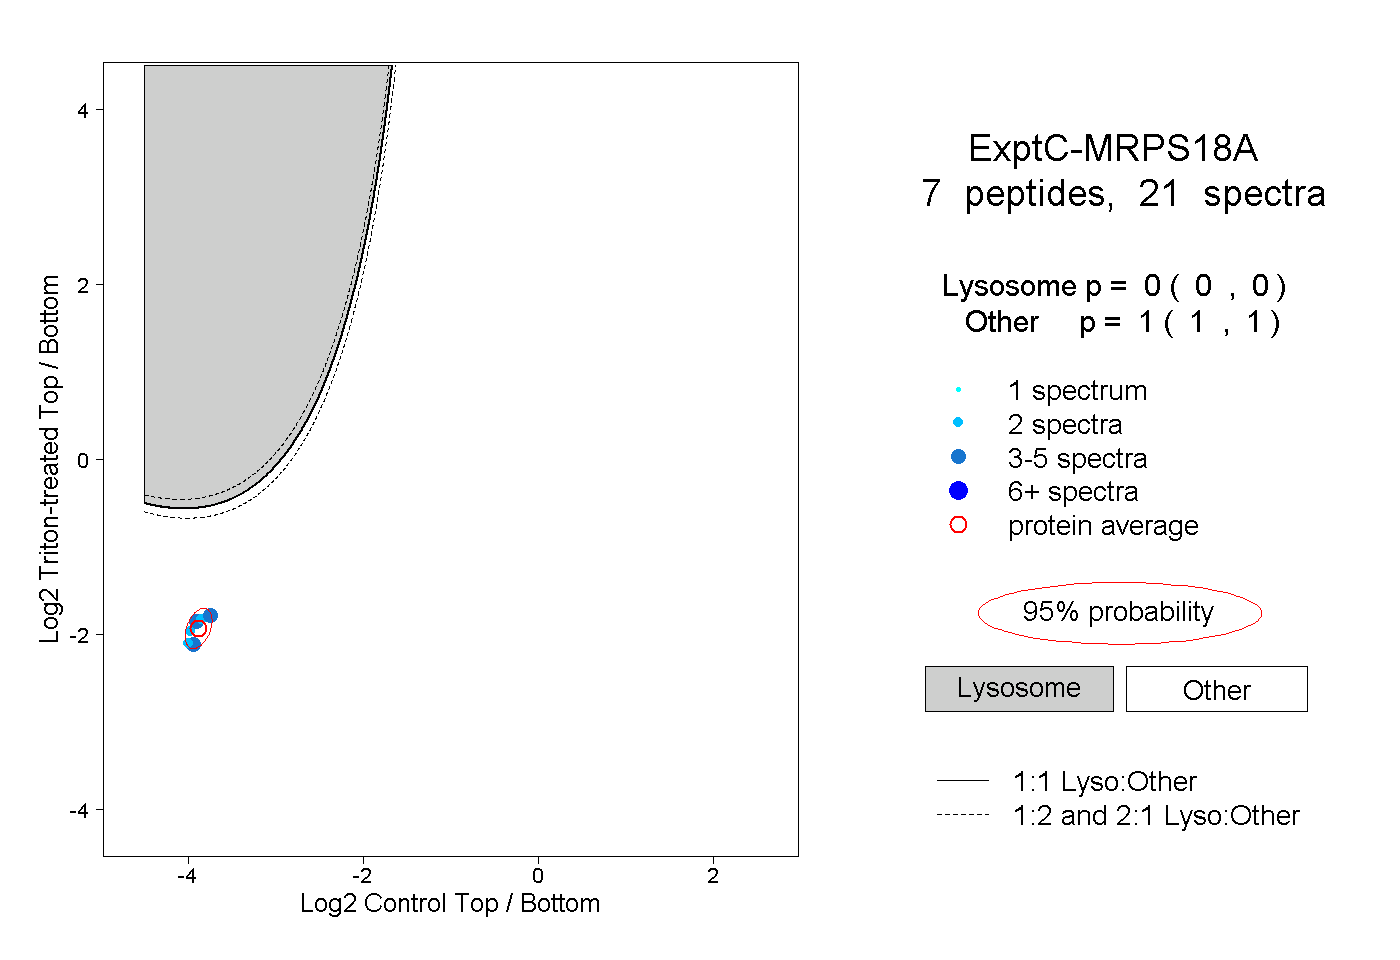
0.000 | 0.000
1.000 | 1.000