 2
2peptides
spectra
0.580 | 0.731
0.000 | 0.000
0.000 | 0.205
0.000 | 0.216
0.000 | 0.000
0.000 | 0.234
0.000 | 0.006
0.000 | 0.056
| Plot | Mito | Lyso | Perox | ER | Golgi | PM | Cytosol | Nucleus | |||||
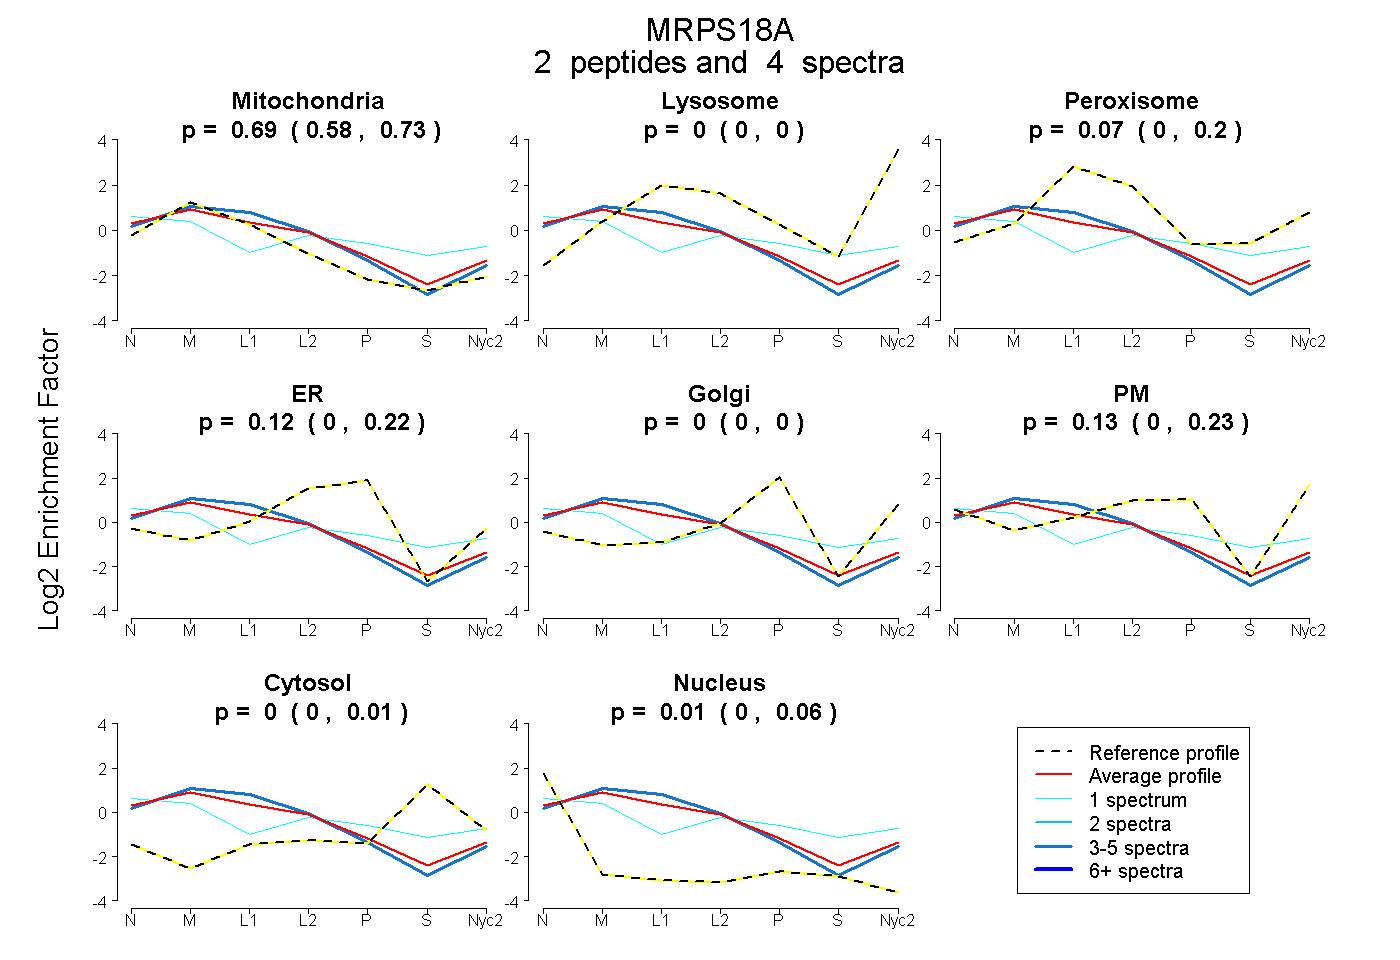
| Expt A |
2 peptides |
4 spectra |
|
0.686 0.580 | 0.731 |
0.000 0.000 | 0.000 |
0.067 0.000 | 0.205 |
0.116 0.000 | 0.216 |
0.000 0.000 | 0.000 |
0.125 0.000 | 0.234 |
0.000 0.000 | 0.006 |
0.007 0.000 | 0.056 |
| 1 spectrum, ATPDPPNPSGQCPICR | 0.365 | 0.000 | 0.000 | 0.000 | 0.000 | 0.371 | 0.200 | 0.064 | ||
| 3 spectra, AGLFPNHRPR | 0.735 | 0.000 | 0.108 | 0.142 | 0.000 | 0.015 | 0.000 | 0.000 |
| Plot | Mito | Lyso or Perox | ER | Golgi | PM | Cytosol | Nucleus | ||||||
| Expt B |
1 peptide |
2 spectra |
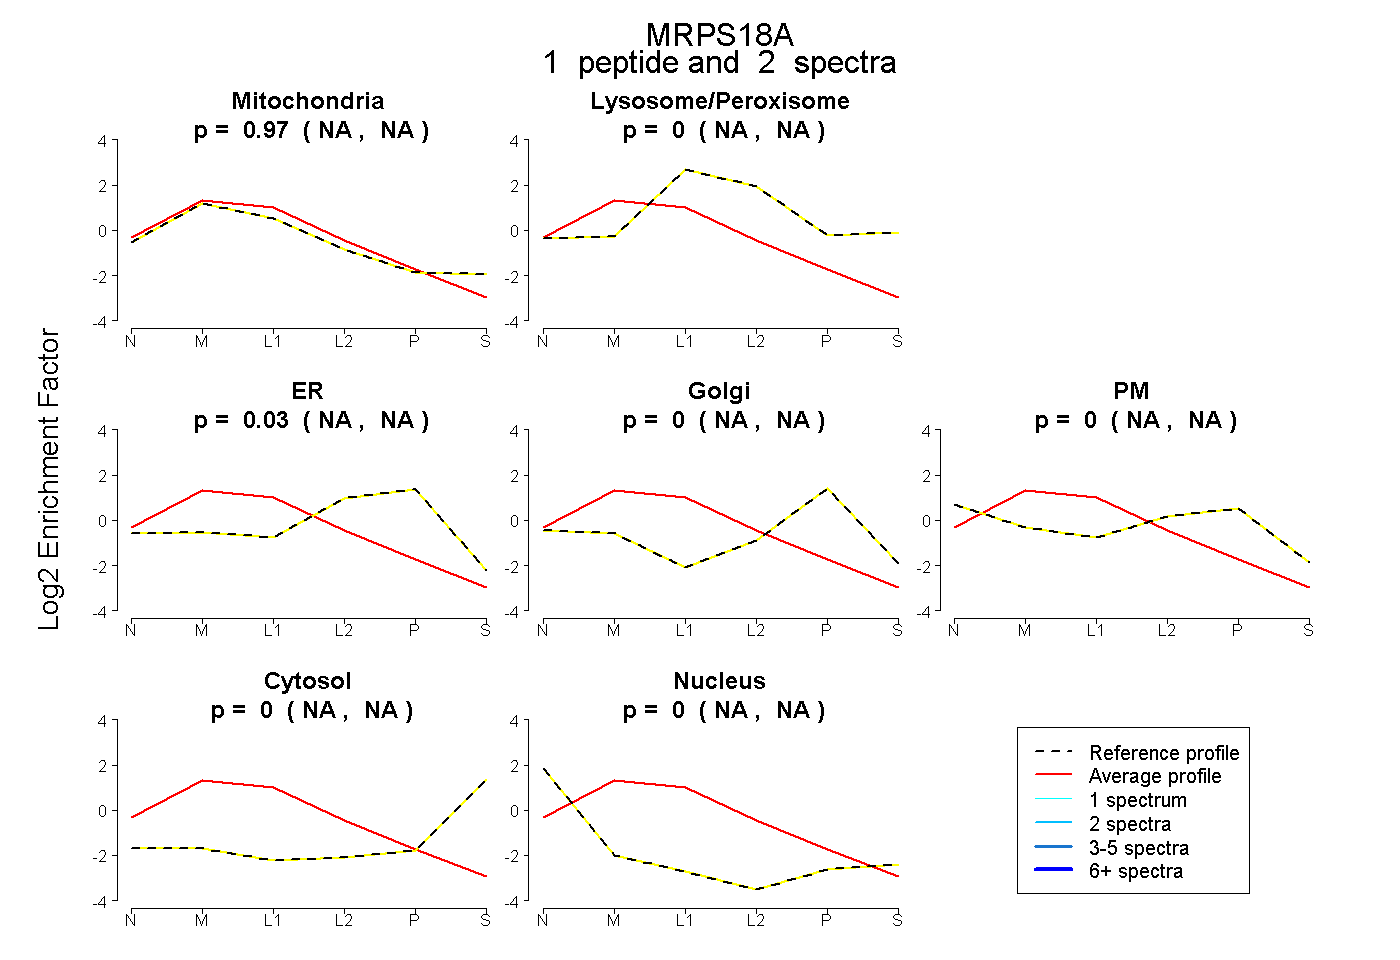 |
0.969 NA | NA |
0.004 NA | NA |
0.026 NA | NA |
0.000 NA | NA |
0.000 NA | NA |
0.000 NA | NA |
0.000 NA | NA |
|||
| Plot | Lyso | Other | |||||||||||
| Expt C |
7 peptides |
21 spectra |
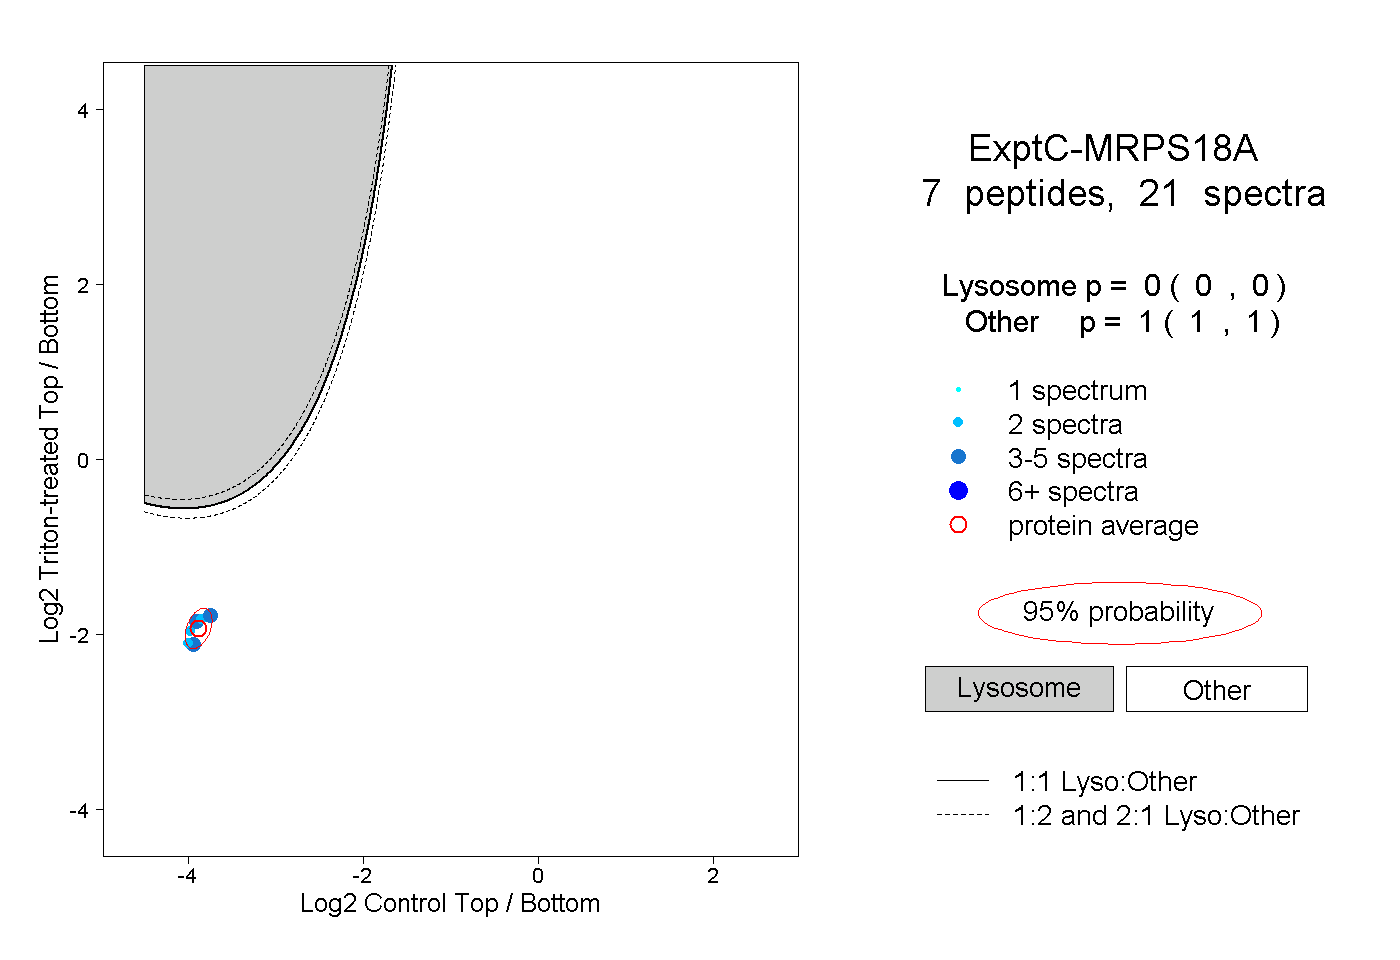 |
0.000 0.000 | 0.000 |
1.000 1.000 | 1.000 |