 3
3peptides
spectra
0.000 | 0.062
0.000 | 0.000
0.039 | 0.173
0.125 | 0.304
0.022 | 0.249
0.000 | 0.086
0.388 | 0.488
0.000 | 0.061
| Plot | Mito | Lyso | Perox | ER | Golgi | PM | Cytosol | Nucleus | |||||
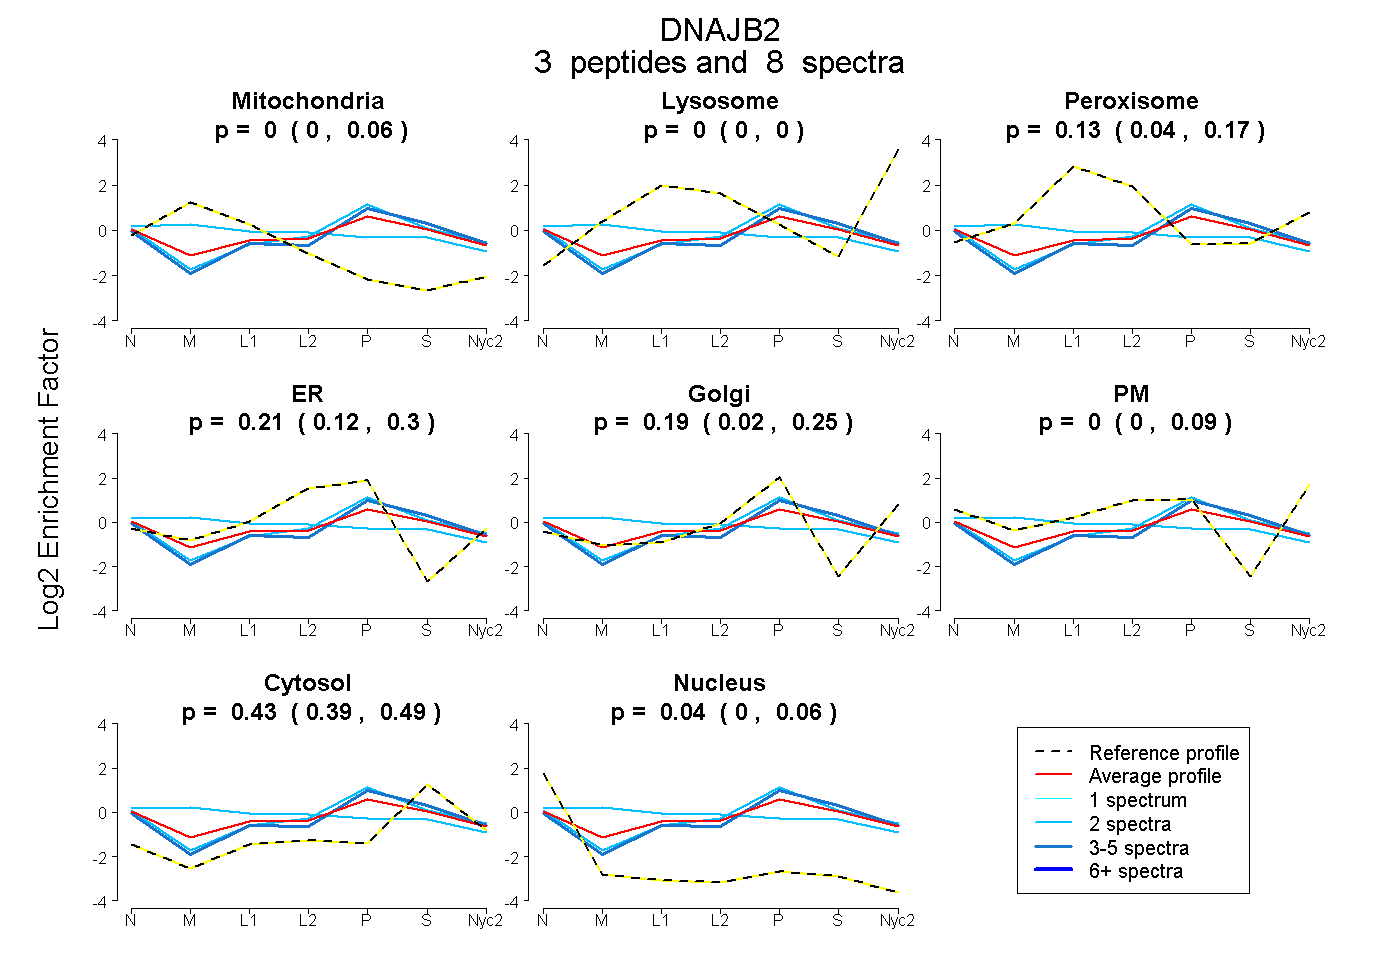
| Expt A |
3 peptides |
8 spectra |
|
0.000 0.000 | 0.062 |
0.000 0.000 | 0.000 |
0.134 0.039 | 0.173 |
0.209 0.125 | 0.304 |
0.188 0.022 | 0.249 |
0.000 0.000 | 0.086 |
0.427 0.388 | 0.488 |
0.041 0.000 | 0.061 |
| 2 spectra, SPEEVFR | 0.000 | 0.000 | 0.000 | 0.317 | 0.199 | 0.008 | 0.477 | 0.000 | ||
| 2 spectra, MASYYEILDVPR | 0.300 | 0.000 | 0.170 | 0.130 | 0.000 | 0.102 | 0.297 | 0.000 | ||
| 4 spectra, SVSTSTTFVQGR | 0.000 | 0.000 | 0.001 | 0.213 | 0.249 | 0.000 | 0.537 | 0.000 |
| Plot | Mito | Lyso or Perox | ER | Golgi | PM | Cytosol | Nucleus | ||||||
| Expt B |
2 peptides |
4 spectra |
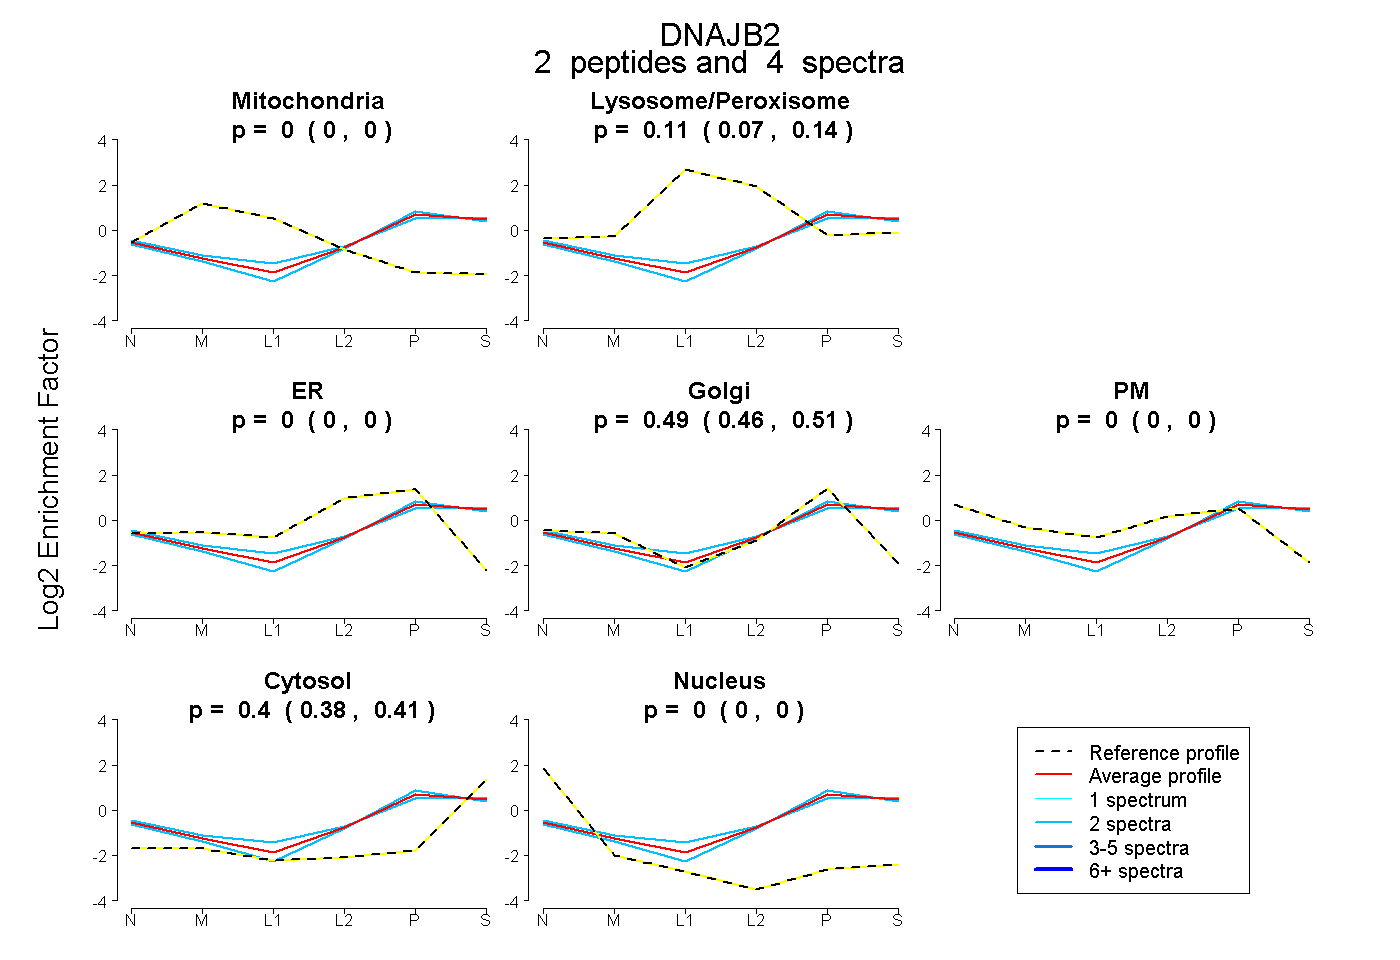 |
0.000 0.000 | 0.000 |
0.110 0.074 | 0.136 |
0.000 0.000 | 0.000 |
0.489 0.463 | 0.511 |
0.000 0.000 | 0.000 |
0.401 0.385 | 0.415 |
0.000 0.000 | 0.000 |
|||
| Plot | Lyso | Other | |||||||||||
| Expt C |
5 peptides |
11 spectra |
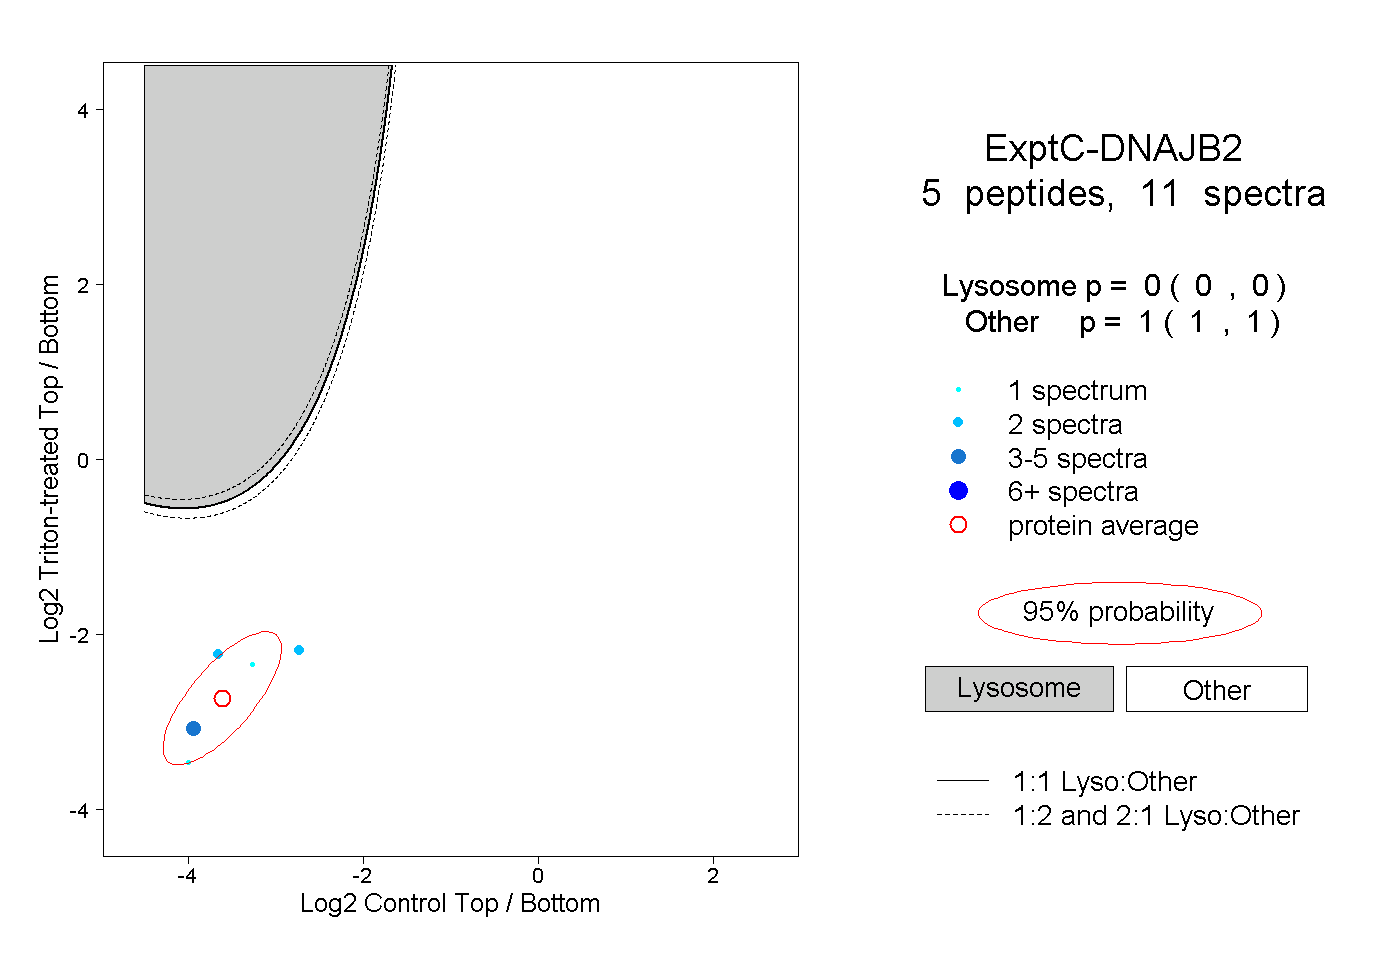 |
0.000 0.000 | 0.000 |
1.000 1.000 | 1.000 |
||||||||
| Plot | Lyso | Other | |||||||||||
| Expt D |
1 peptide |
1 spectrum |
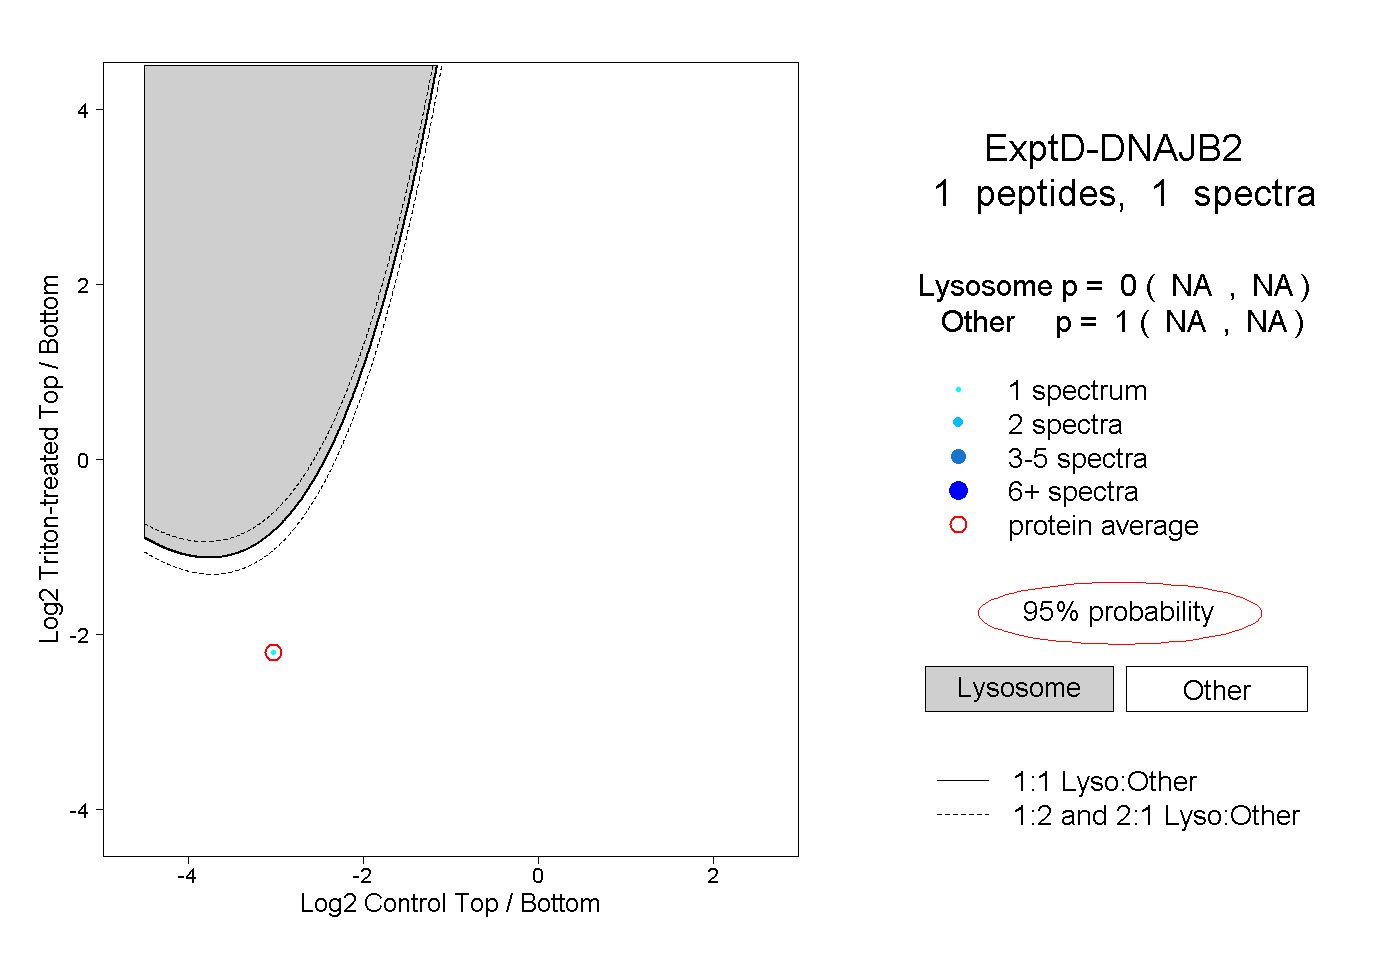 |
0.000 NA | NA |
1.000 NA | NA |