 8
8peptides
spectra
0.676 | 0.714
0.042 | 0.096
0.044 | 0.108
0.000 | 0.000
0.000 | 0.000
0.123 | 0.175
0.000 | 0.000
0.000 | 0.000
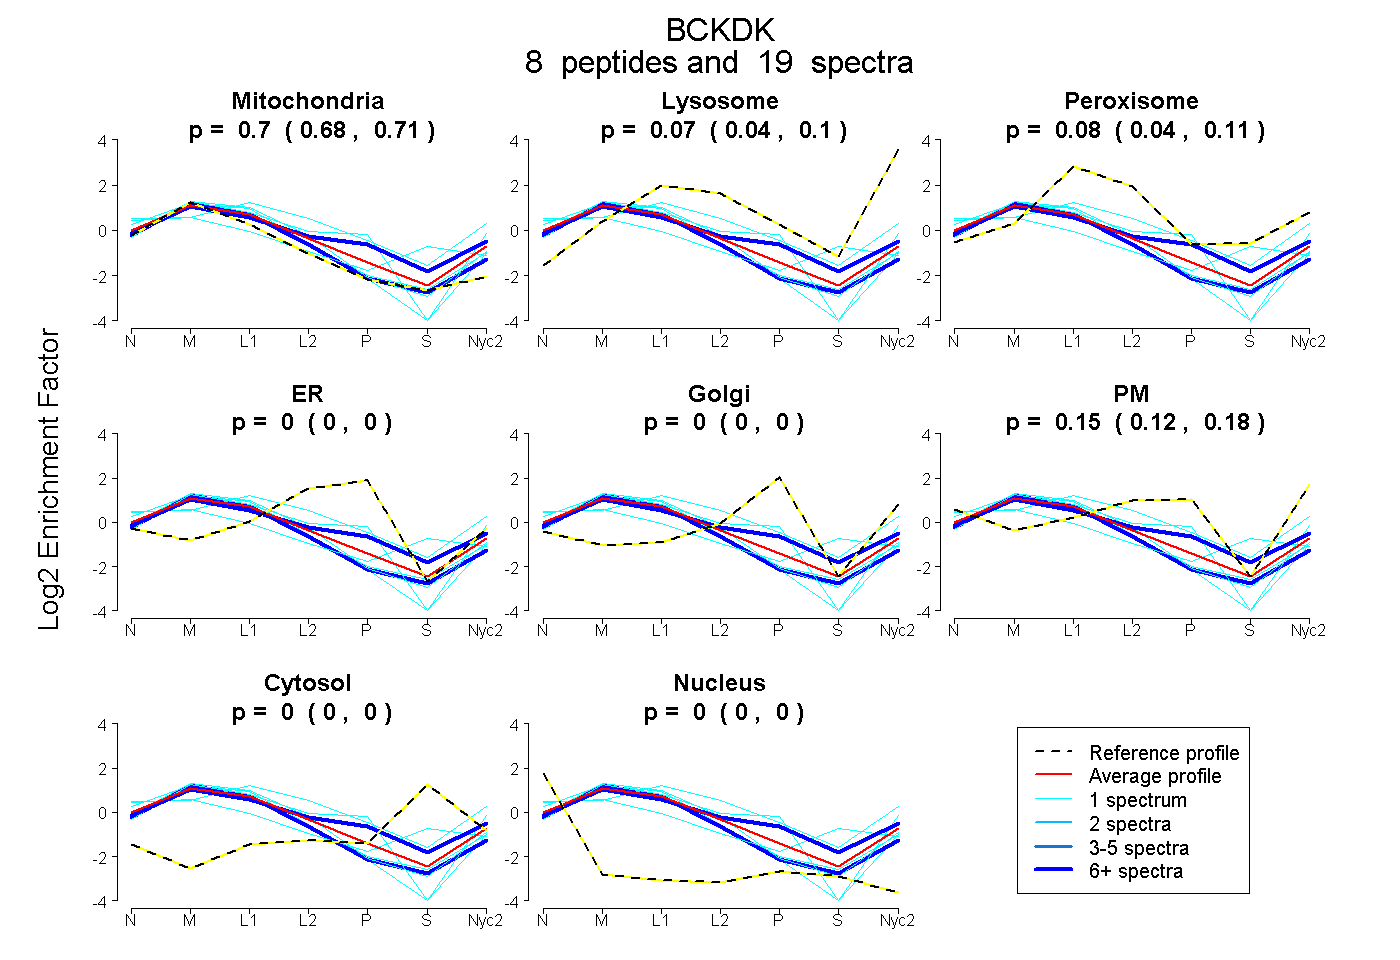
| Plot | Mito | Lyso | Perox | ER | Golgi | PM | Cytosol | Nucleus | |||||
| Expt A |
8 peptides |
19 spectra |
|
0.696 0.676 | 0.714 |
0.072 0.042 | 0.096 |
0.079 0.044 | 0.108 |
0.000 0.000 | 0.000 |
0.000 0.000 | 0.000 |
0.152 0.123 | 0.175 |
0.000 0.000 | 0.000 |
0.000 0.000 | 0.000 |
| 1 spectrum, DVVTLLAEGLR | 0.844 | 0.151 | 0.000 | 0.000 | 0.000 | 0.006 | 0.000 | 0.000 | ||
| 1 spectrum, TVTSFYNQSAIDVVAEKPSVR | 0.793 | 0.116 | 0.089 | 0.000 | 0.000 | 0.002 | 0.000 | 0.000 | ||
| 1 spectrum, STSATDTHHVELAR | 0.280 | 0.000 | 0.363 | 0.000 | 0.000 | 0.343 | 0.000 | 0.013 | ||
| 7 spectra, LTPTMMLYSGR | 0.876 | 0.097 | 0.027 | 0.000 | 0.000 | 0.000 | 0.000 | 0.000 | ||
| 1 spectrum, MLATHHLALHEDKPDFVGIICTR | 0.518 | 0.062 | 0.000 | 0.104 | 0.000 | 0.316 | 0.000 | 0.000 | ||
| 1 spectrum, WVDFAR | 0.549 | 0.000 | 0.149 | 0.000 | 0.000 | 0.024 | 0.235 | 0.044 | ||
| 6 spectra, YGNAPR | 0.548 | 0.064 | 0.163 | 0.000 | 0.143 | 0.082 | 0.000 | 0.000 | ||
| 1 spectrum, GGGIAHK | 0.841 | 0.004 | 0.000 | 0.000 | 0.000 | 0.155 | 0.000 | 0.000 |
| Plot | Mito | Lyso or Perox | ER | Golgi | PM | Cytosol | Nucleus | ||||||
| Expt B |
3 peptides |
5 spectra |
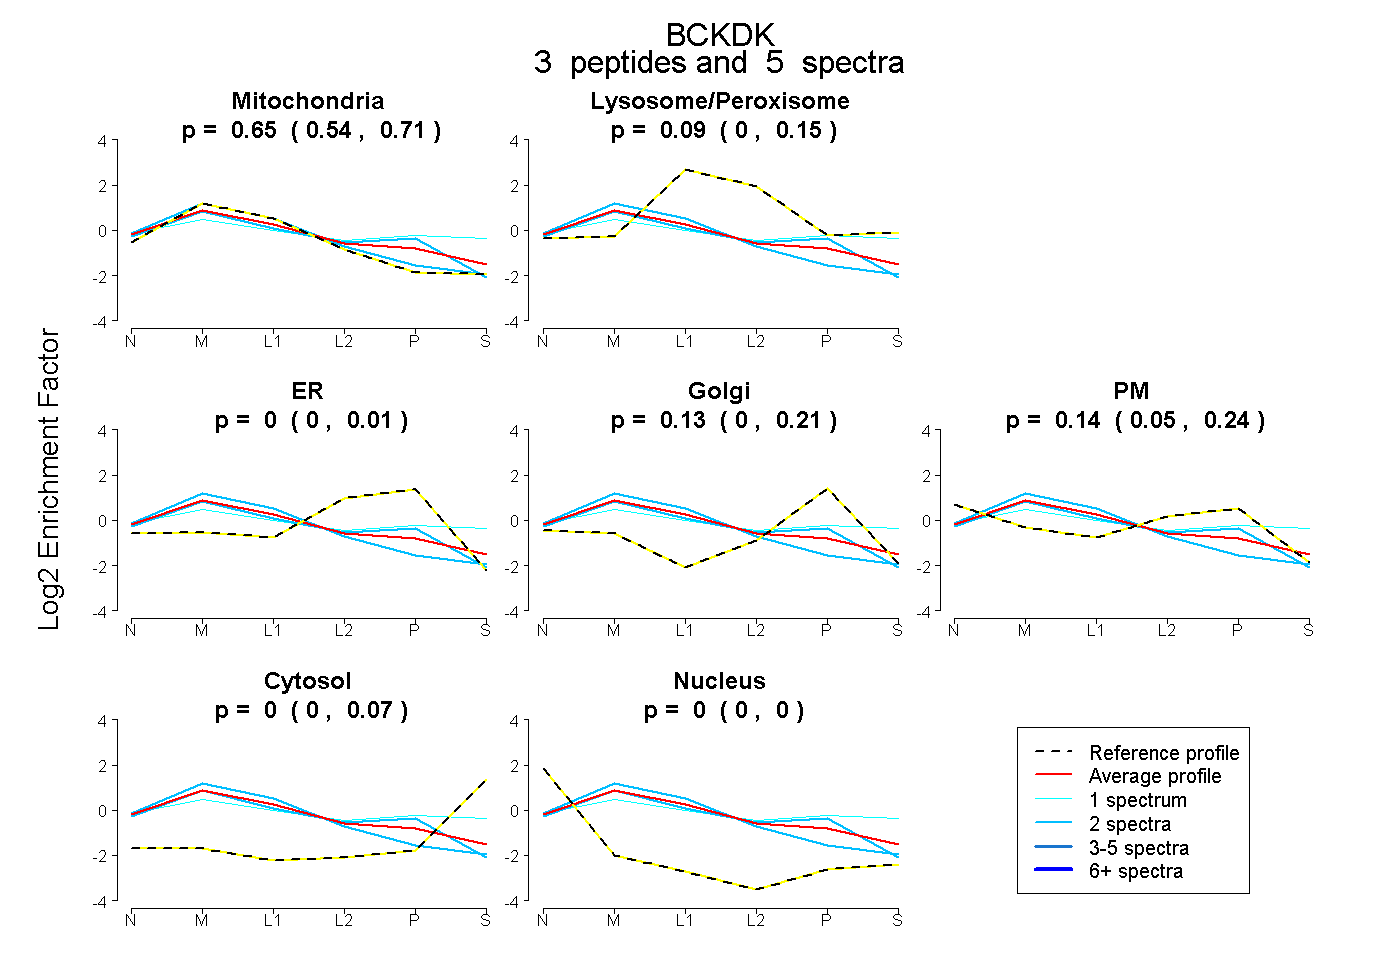 |
0.645 0.544 | 0.712 |
0.090 0.000 | 0.148 |
0.000 0.000 | 0.010 |
0.128 0.000 | 0.206 |
0.137 0.052 | 0.238 |
0.000 0.000 | 0.073 |
0.000 0.000 | 0.000 |
|||
| Plot | Lyso | Other | |||||||||||
| Expt C |
11 peptides |
58 spectra |
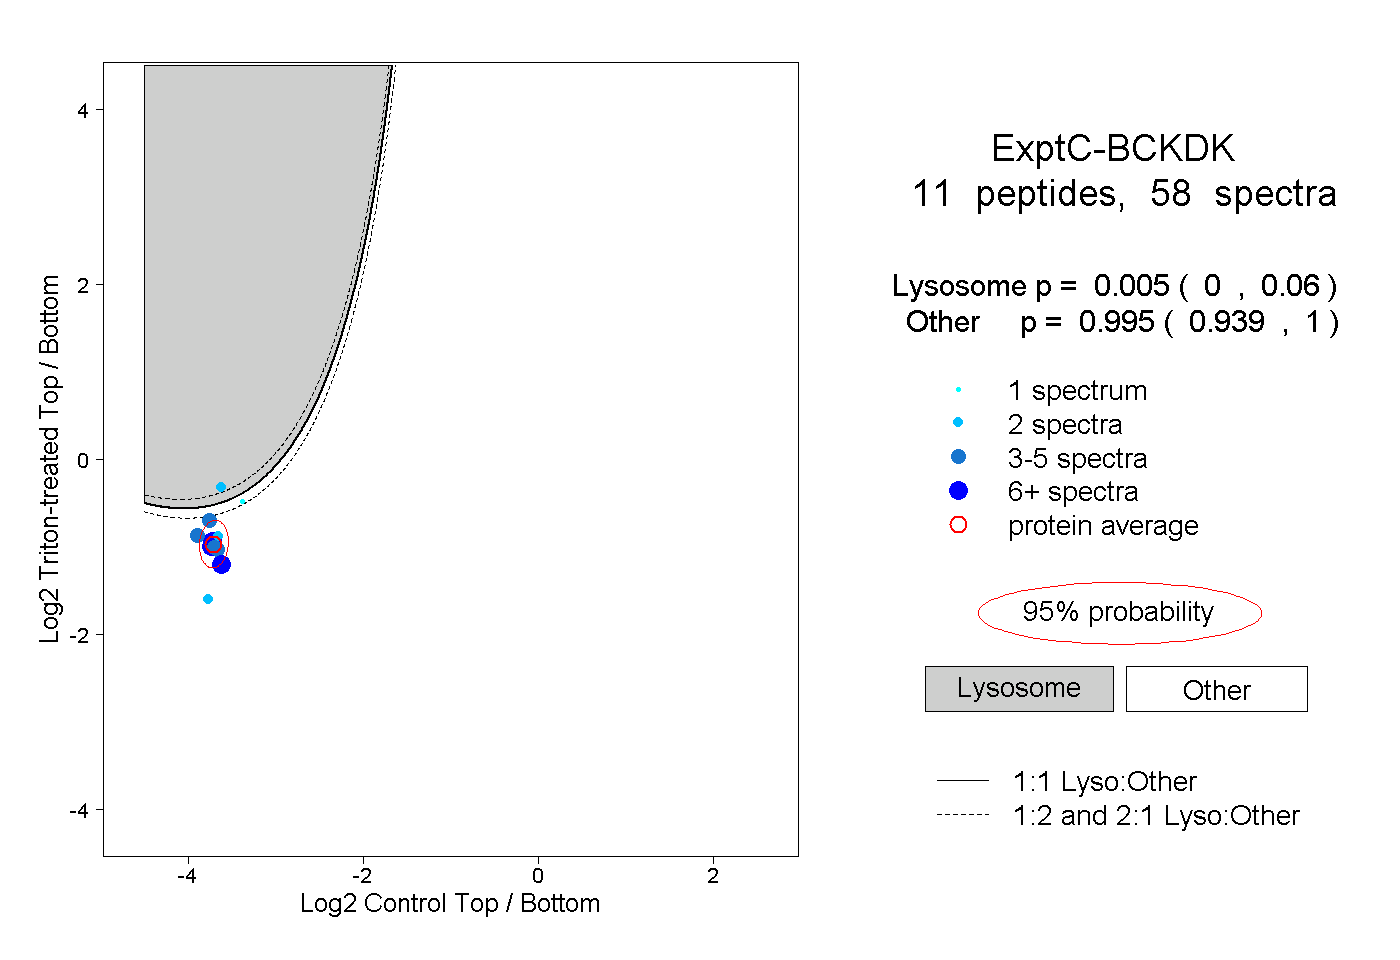 |
0.005 0.000 | 0.060 |
0.995 0.939 | 1.000 |
||||||||
| Plot | Lyso | Other | |||||||||||
| Expt D |
1 peptide |
2 spectra |
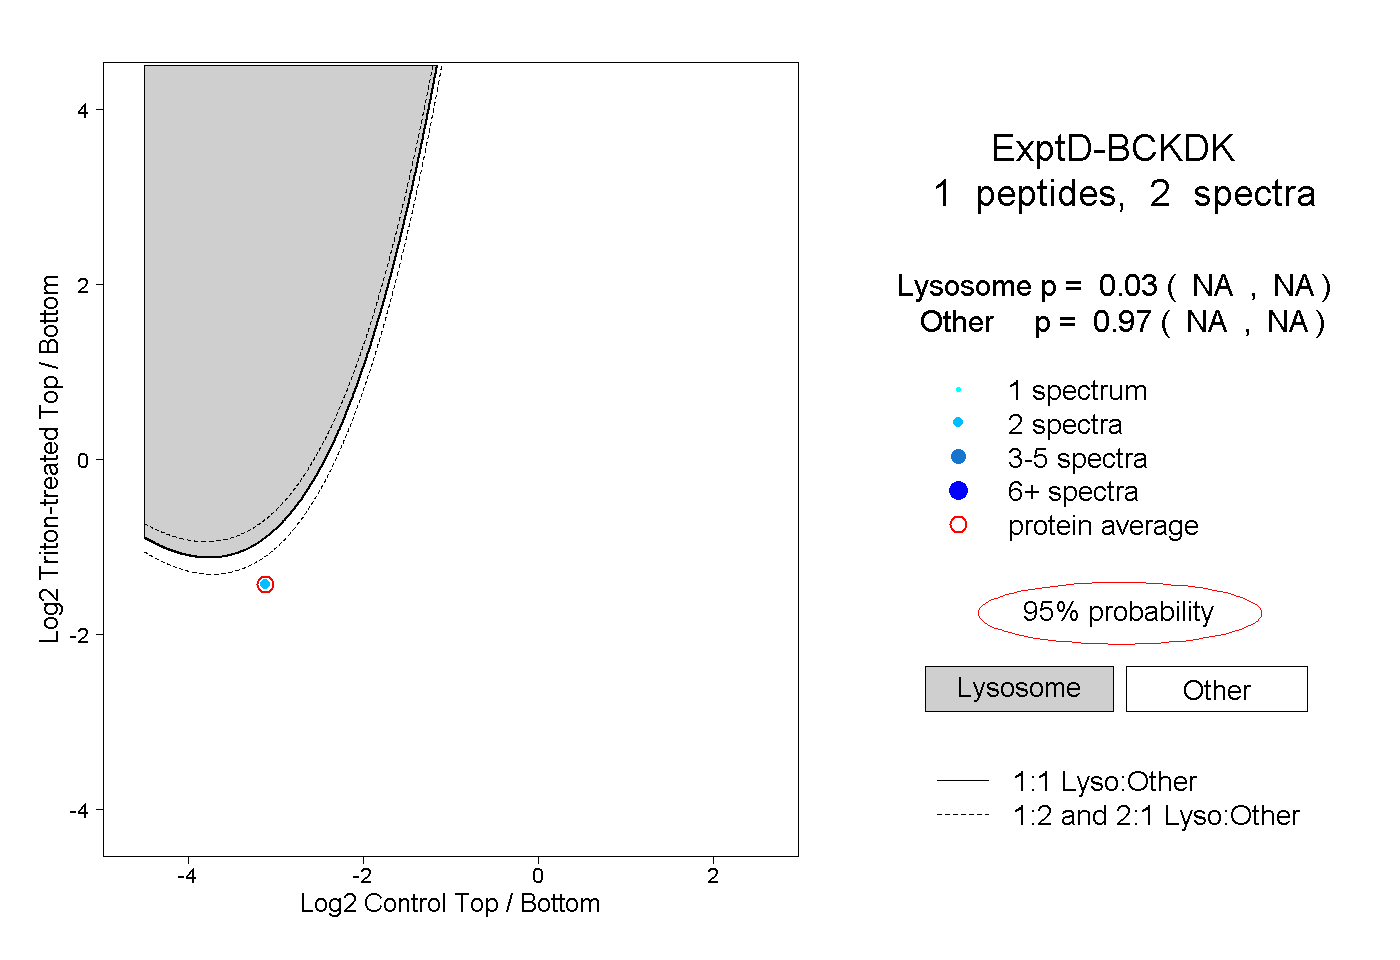 |
0.030 NA | NA |
0.970 NA | NA |