 10
10peptides
spectra
0.000 | 0.000
0.046 | 0.064
0.000 | 0.000
0.000 | 0.000
0.000 | 0.000
0.221 | 0.239
0.706 | 0.719
0.000 | 0.000
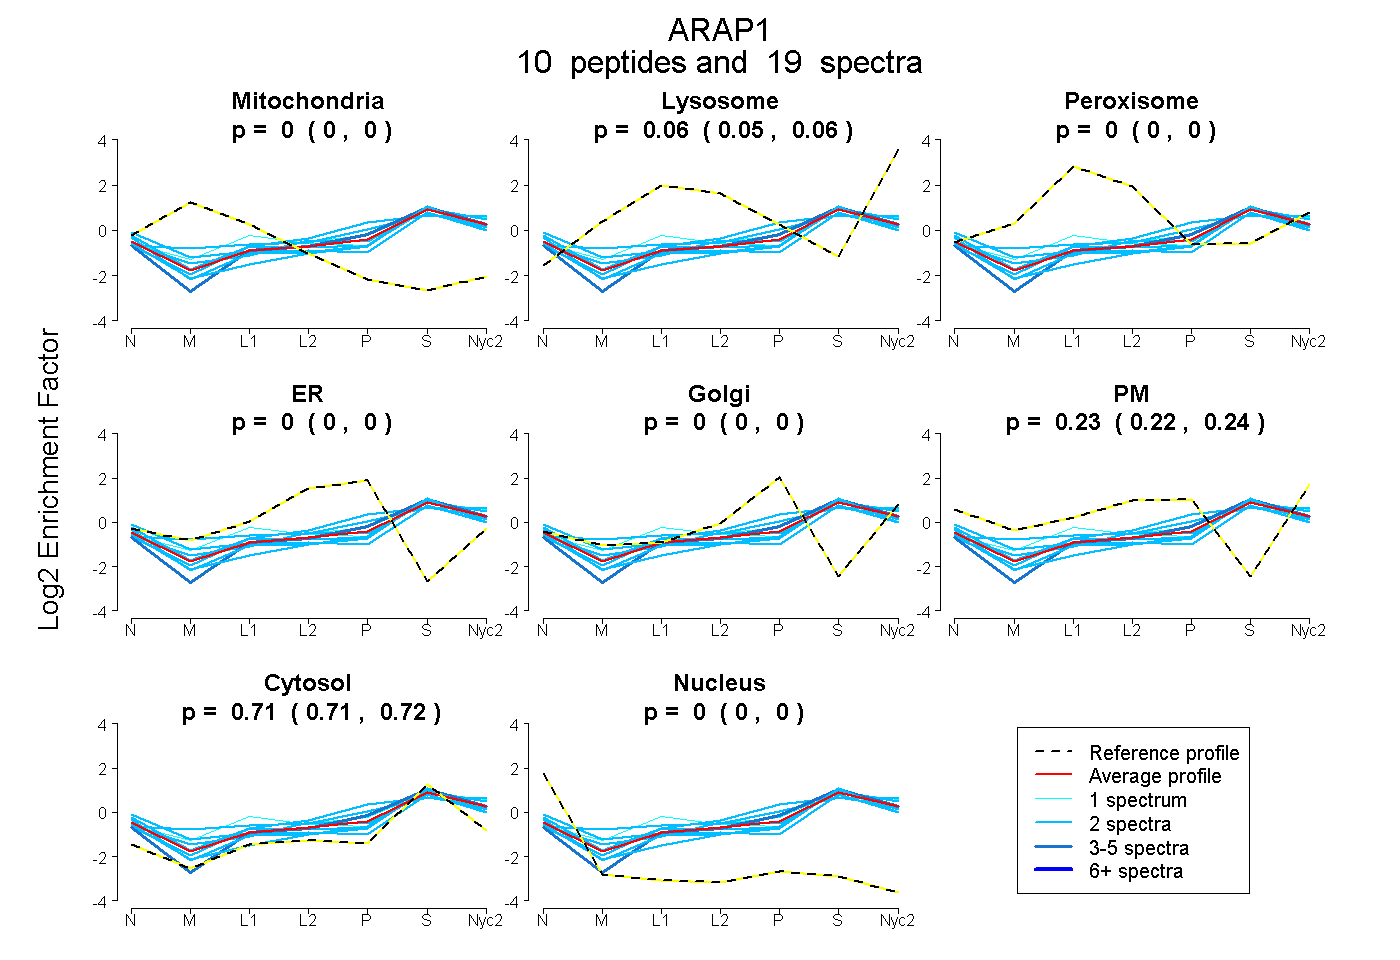
| Plot | Mito | Lyso | Perox | ER | Golgi | PM | Cytosol | Nucleus | |||||
| Expt A |
10 peptides |
19 spectra |
|
0.000 0.000 | 0.000 |
0.056 0.046 | 0.064 |
0.000 0.000 | 0.000 |
0.000 0.000 | 0.000 |
0.000 0.000 | 0.000 |
0.231 0.221 | 0.239 |
0.713 0.706 | 0.719 |
0.000 0.000 | 0.000 |
| 2 spectra, LLDSLR | 0.000 | 0.000 | 0.000 | 0.000 | 0.000 | 0.175 | 0.825 | 0.000 | ||
| 3 spectra, LDADHLR | 0.000 | 0.048 | 0.000 | 0.000 | 0.080 | 0.121 | 0.751 | 0.000 | ||
| 2 spectra, FEVITNSR | 0.054 | 0.000 | 0.042 | 0.000 | 0.000 | 0.218 | 0.687 | 0.000 | ||
| 2 spectra, GGTEQPDHAGSLELR | 0.000 | 0.055 | 0.000 | 0.000 | 0.046 | 0.319 | 0.579 | 0.000 | ||
| 1 spectrum, EEAERPLHFAEK | 0.000 | 0.072 | 0.000 | 0.000 | 0.000 | 0.259 | 0.669 | 0.000 | ||
| 2 spectra, AVFPEGPWEEPLQLR | 0.000 | 0.097 | 0.021 | 0.000 | 0.000 | 0.128 | 0.754 | 0.000 | ||
| 2 spectra, SFDLTTPYR | 0.000 | 0.000 | 0.000 | 0.000 | 0.000 | 0.224 | 0.776 | 0.000 | ||
| 2 spectra, ELLVHLPPVNR | 0.000 | 0.095 | 0.113 | 0.000 | 0.158 | 0.075 | 0.560 | 0.000 | ||
| 2 spectra, IWAAAPNR | 0.000 | 0.112 | 0.000 | 0.000 | 0.000 | 0.195 | 0.693 | 0.000 | ||
| 1 spectrum, DLPDGLFTR | 0.000 | 0.017 | 0.227 | 0.000 | 0.000 | 0.106 | 0.650 | 0.000 |
| Plot | Mito | Lyso or Perox | ER | Golgi | PM | Cytosol | Nucleus | ||||||
| Expt B |
2 peptides |
2 spectra |
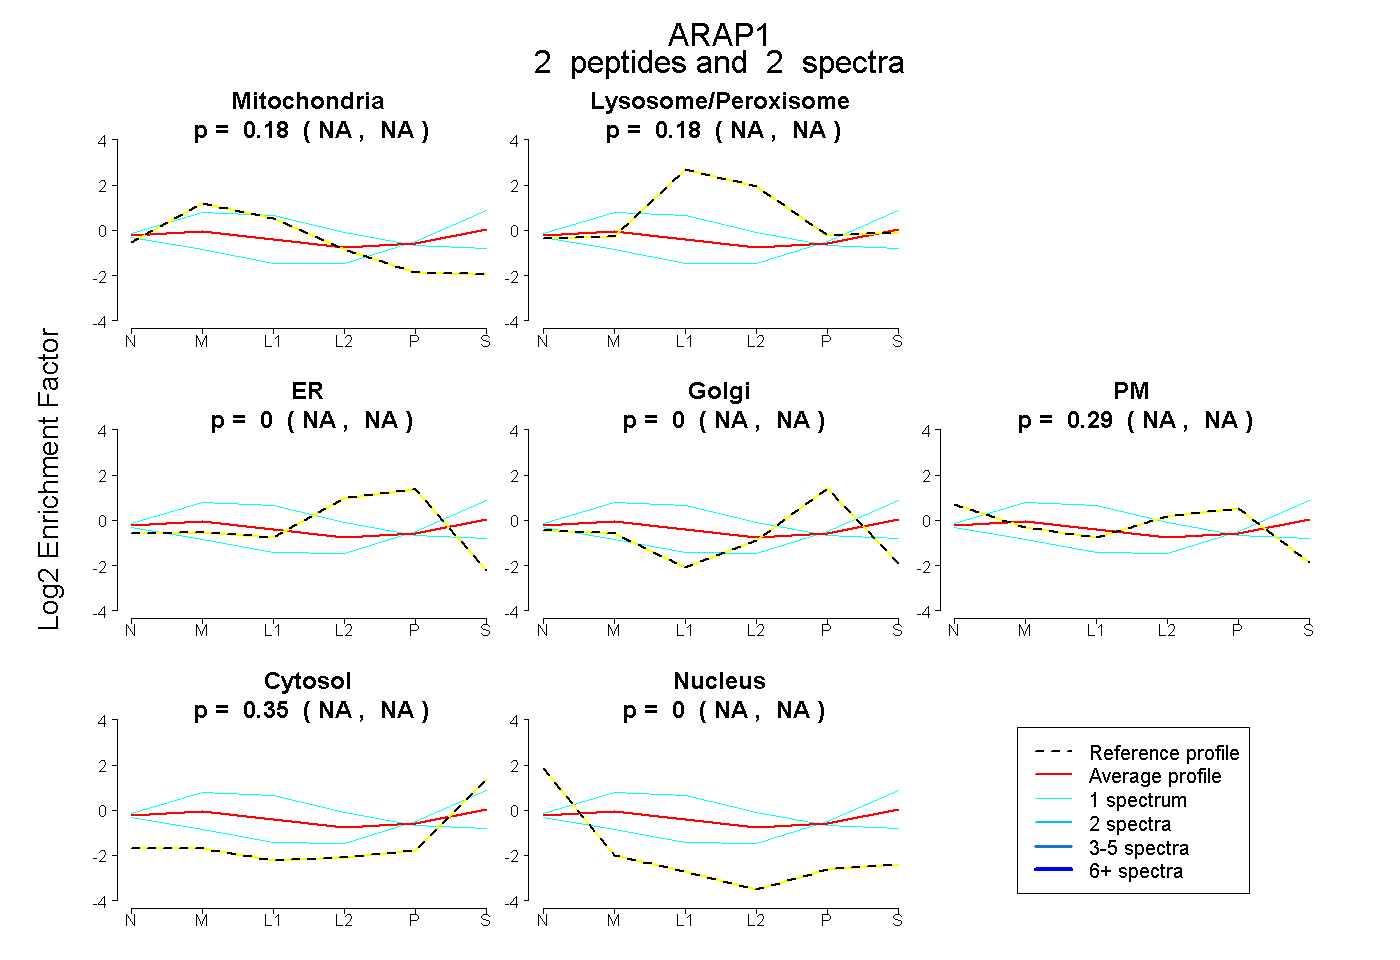 |
0.178 NA | NA |
0.176 NA | NA |
0.000 NA | NA |
0.000 NA | NA |
0.292 NA | NA |
0.354 NA | NA |
0.000 NA | NA |
|||
| Plot | Lyso | Other | |||||||||||
| Expt C |
15 peptides |
27 spectra |
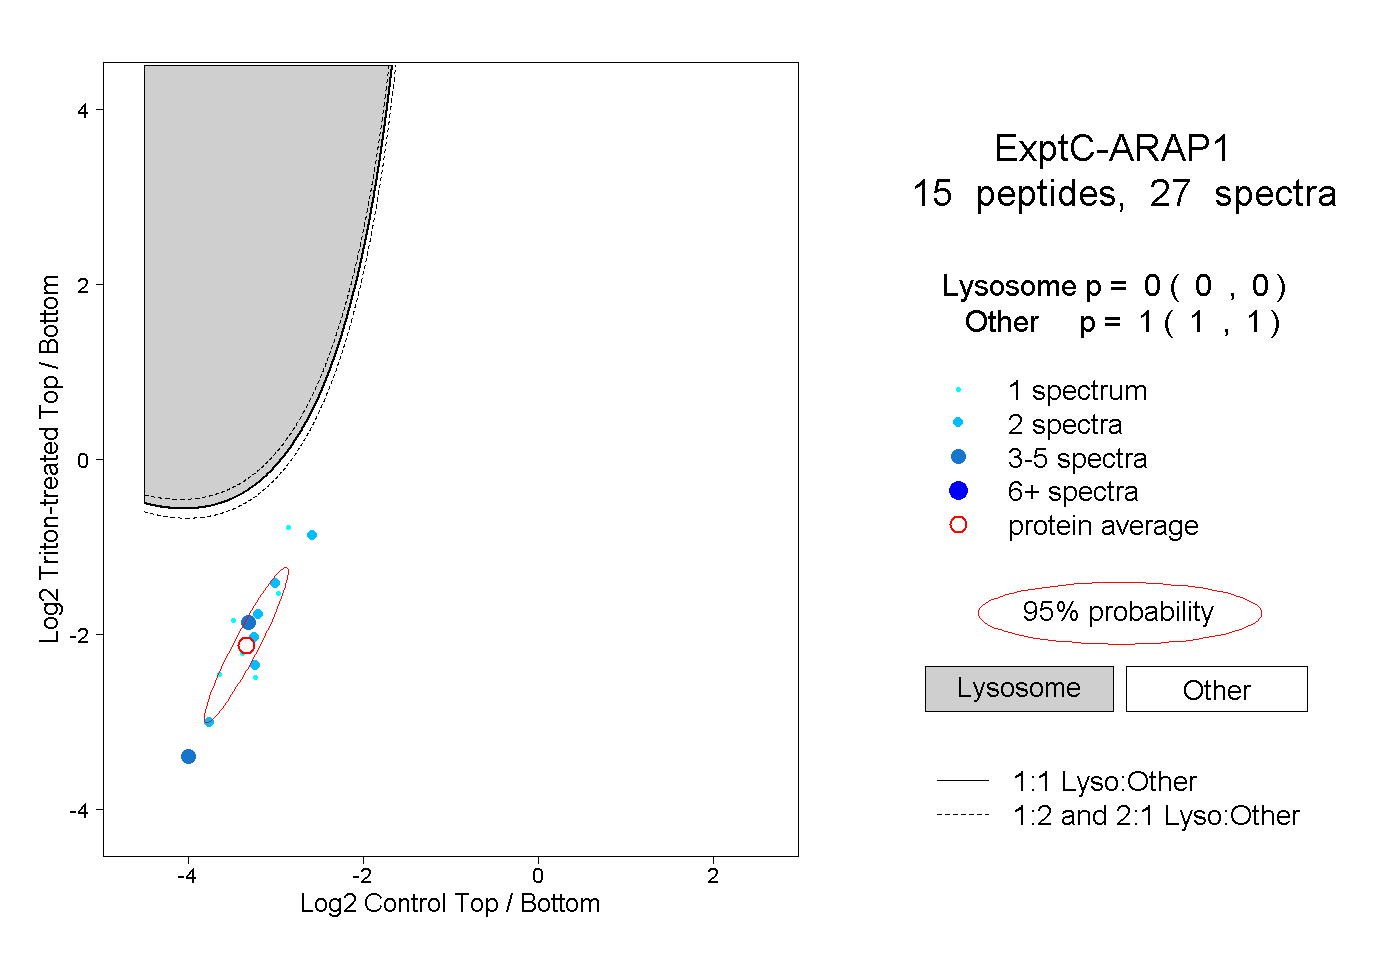 |
0.000 0.000 | 0.000 |
1.000 1.000 | 1.000 |
||||||||
| Plot | Lyso | Other | |||||||||||
| Expt D |
2 peptides |
5 spectra |
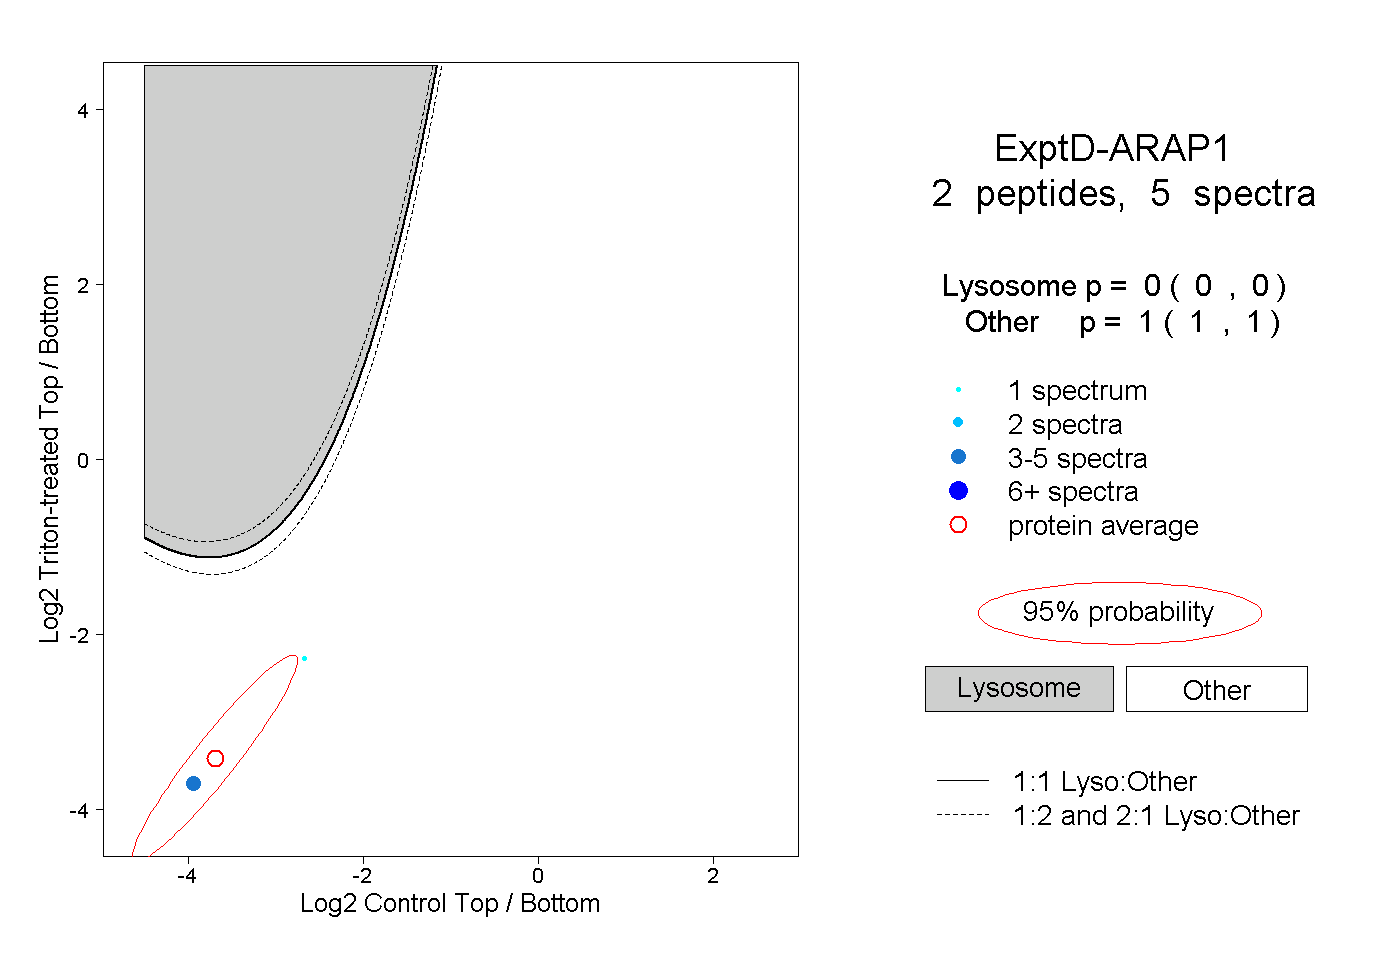 |
0.000 0.000 | 0.000 |
1.000 1.000 | 1.000 |