 26
26peptides
spectra
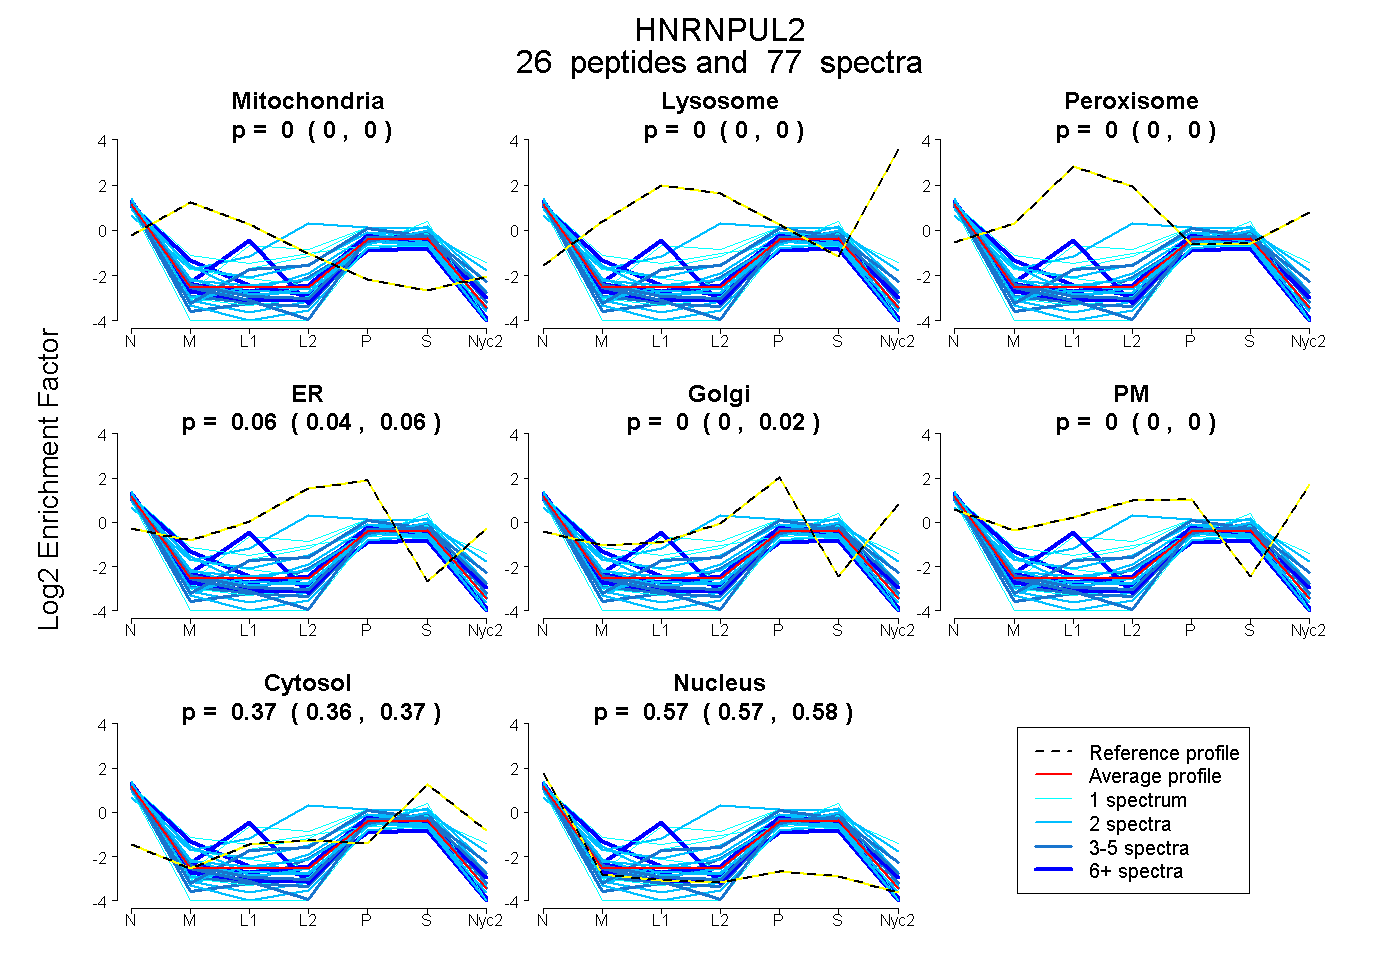
0.000 | 0.000
0.000 | 0.000
0.000 | 0.000
0.042 | 0.065
0.000 | 0.017
0.000 | 0.000
0.362 | 0.368
0.569 | 0.576
6peptides
spectra
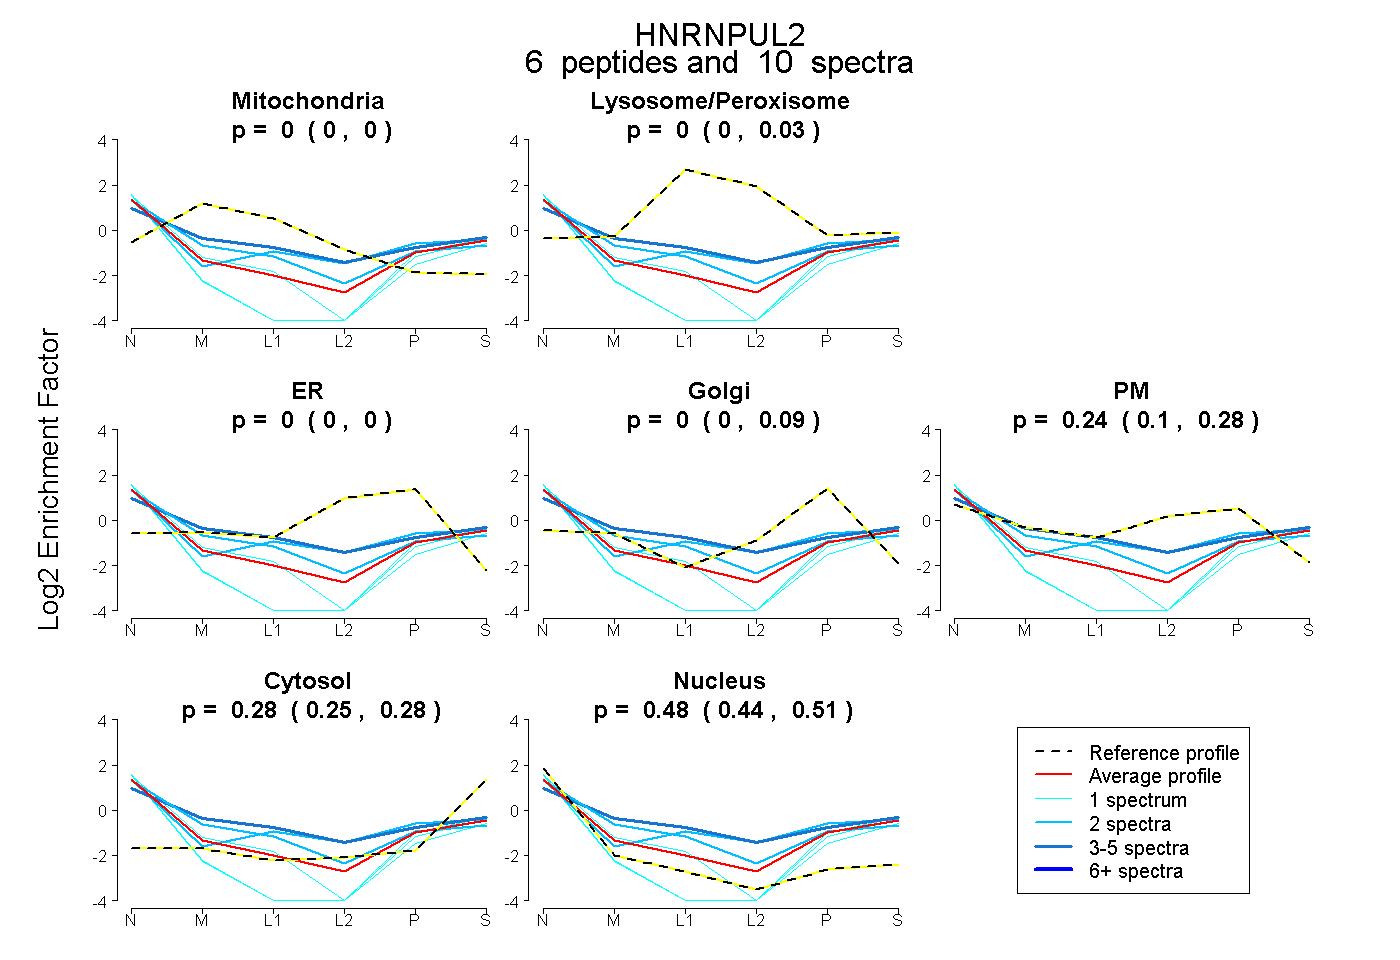
0.000 | 0.000
0.000 | 0.033
0.000 | 0.000
0.000 | 0.090
0.101 | 0.279
0.253 | 0.284
0.441 | 0.514
7peptides
spectra
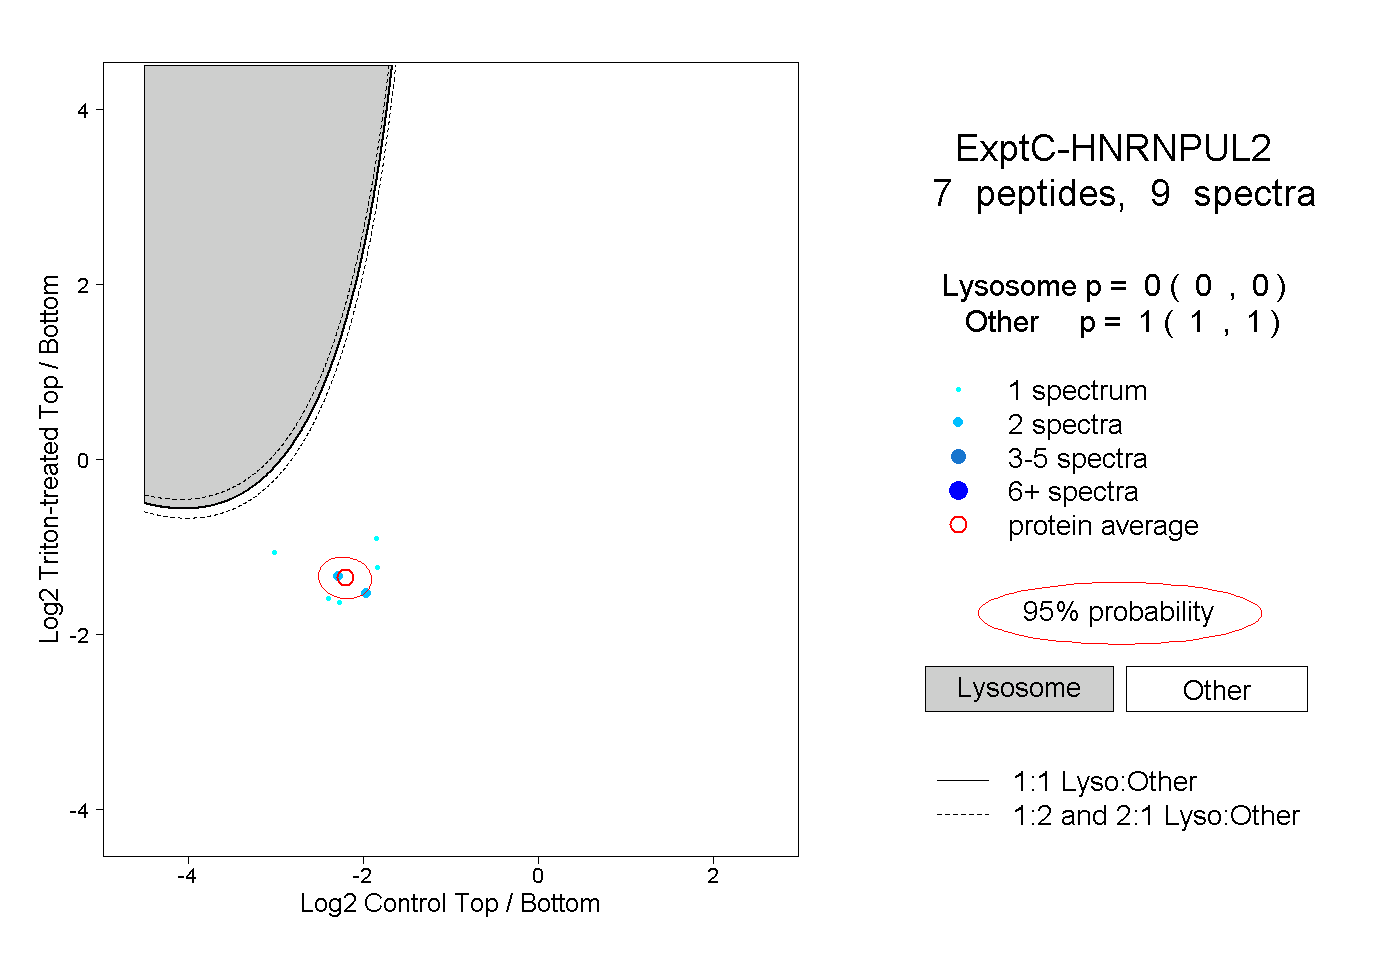
0.000 | 0.000
1.000 | 1.000