 5
5peptides
spectra
0.000 | 0.000
0.000 | 0.000
0.000 | 0.000
0.537 | 0.642
0.257 | 0.349
0.015 | 0.094
0.000 | 0.064
0.000 | 0.017
| Plot | Mito | Lyso | Perox | ER | Golgi | PM | Cytosol | Nucleus | |||||
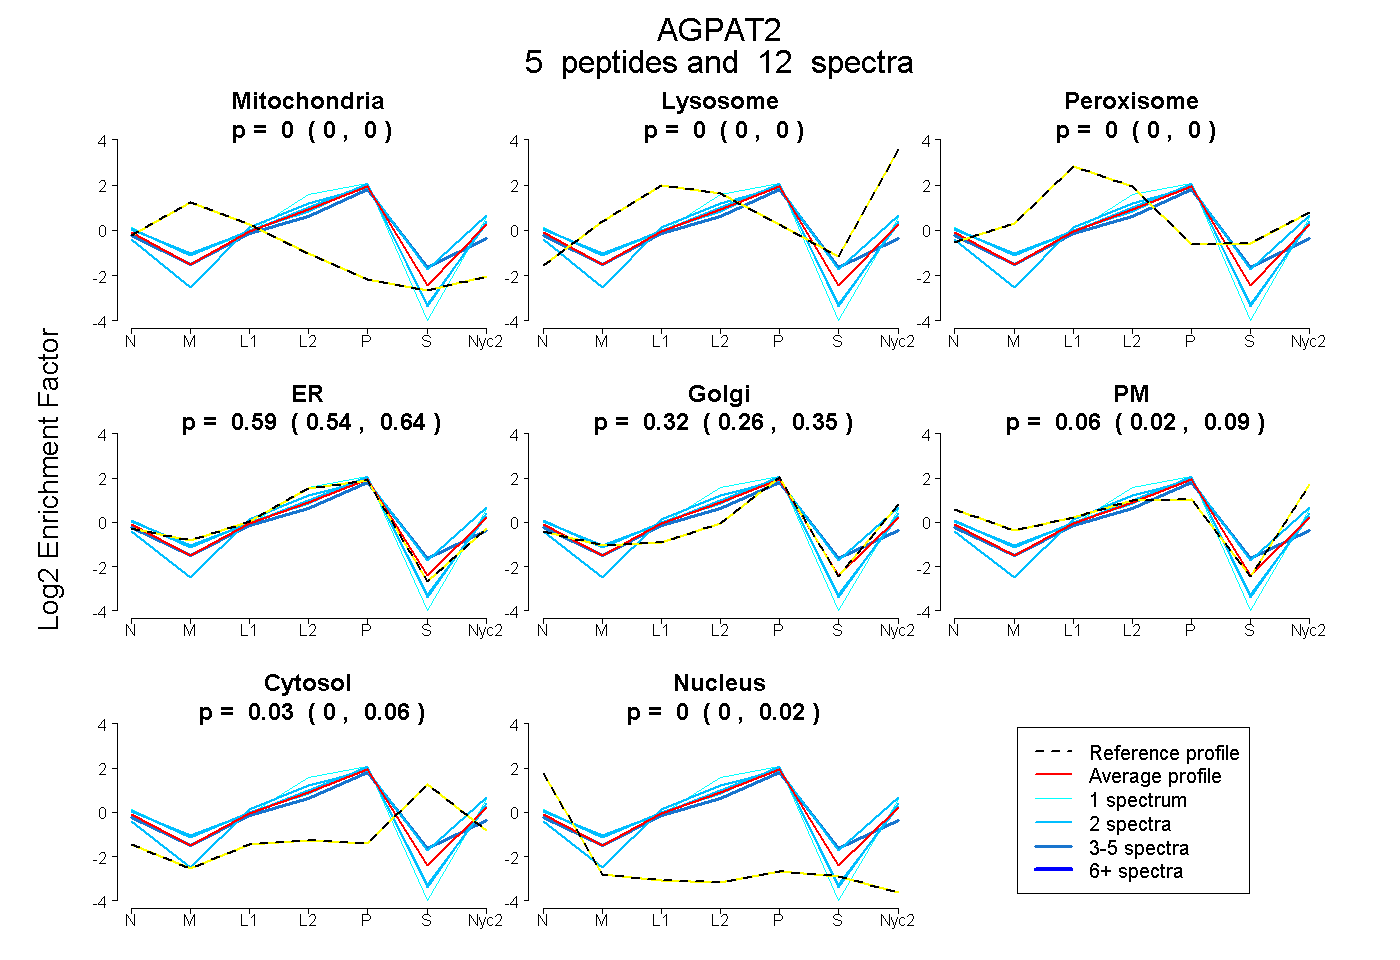
| Expt A |
5 peptides |
12 spectra |
|
0.000 0.000 | 0.000 |
0.000 0.000 | 0.000 |
0.000 0.000 | 0.000 |
0.595 0.537 | 0.642 |
0.315 0.257 | 0.349 |
0.056 0.015 | 0.094 |
0.034 0.000 | 0.064 |
0.000 0.000 | 0.017 |
| 2 spectra, TAMSLMADLGDLMVK | 0.000 | 0.077 | 0.000 | 0.556 | 0.241 | 0.000 | 0.125 | 0.000 | ||
| 5 spectra, LFTSGTIR | 0.000 | 0.000 | 0.000 | 0.652 | 0.171 | 0.000 | 0.177 | 0.000 | ||
| 2 spectra, YVYGLR | 0.000 | 0.000 | 0.000 | 0.557 | 0.302 | 0.138 | 0.000 | 0.003 | ||
| 1 spectrum, NDNGDLLPFK | 0.000 | 0.000 | 0.000 | 0.743 | 0.033 | 0.224 | 0.000 | 0.000 | ||
| 2 spectra, VWIYPEGTR | 0.000 | 0.000 | 0.000 | 0.641 | 0.237 | 0.120 | 0.000 | 0.002 |
| Plot | Mito | Lyso or Perox | ER | Golgi | PM | Cytosol | Nucleus | ||||||
| Expt B |
1 peptide |
2 spectra |
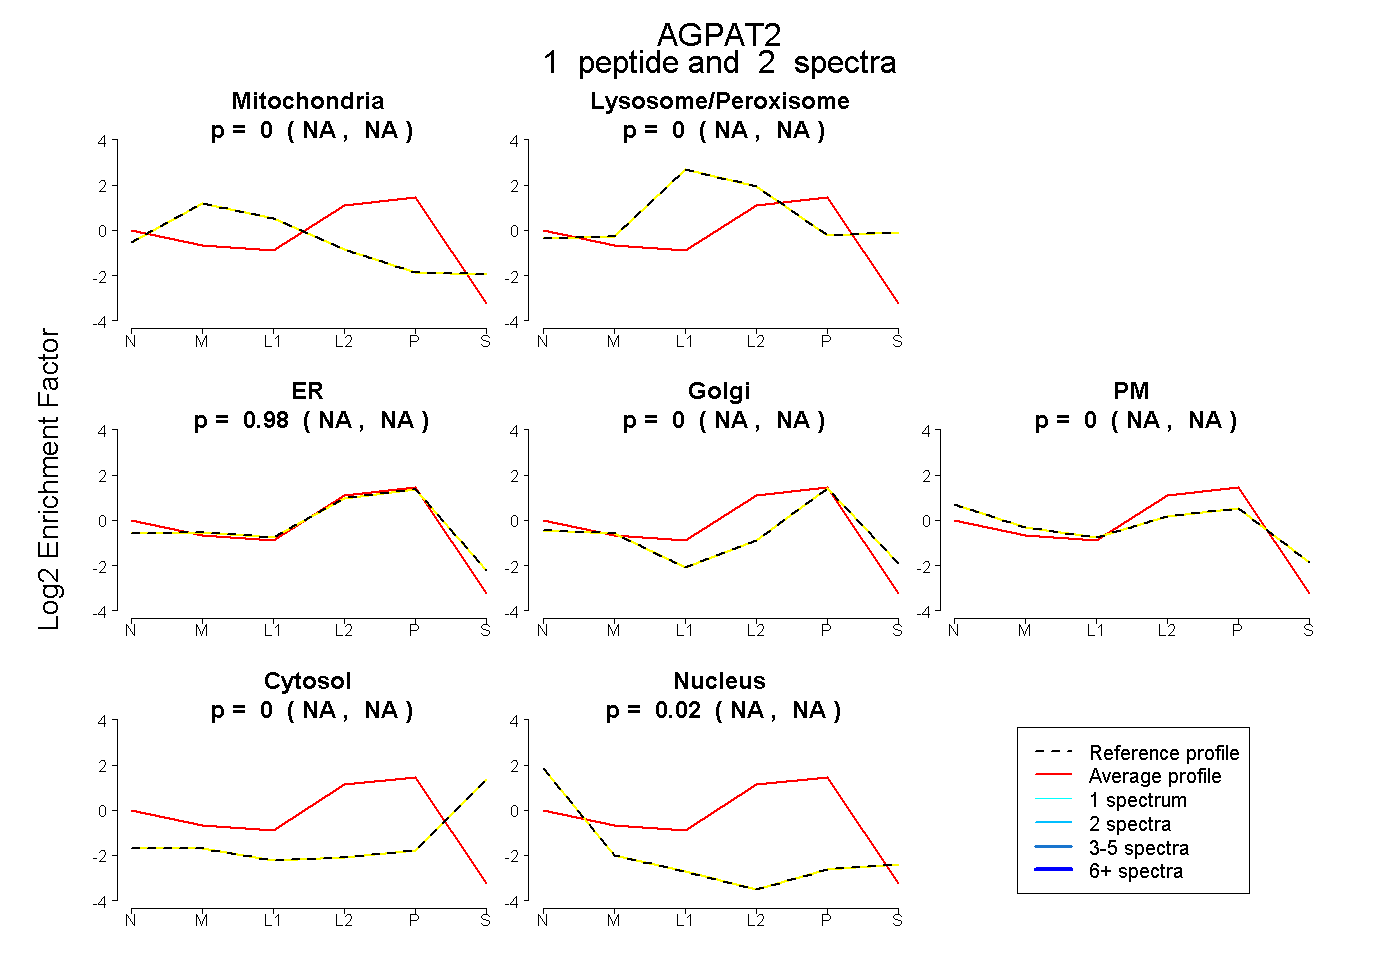 |
0.000 NA | NA |
0.000 NA | NA |
0.978 NA | NA |
0.000 NA | NA |
0.000 NA | NA |
0.000 NA | NA |
0.022 NA | NA |
|||
| Plot | Lyso | Other | |||||||||||
| Expt C |
7 peptides |
20 spectra |
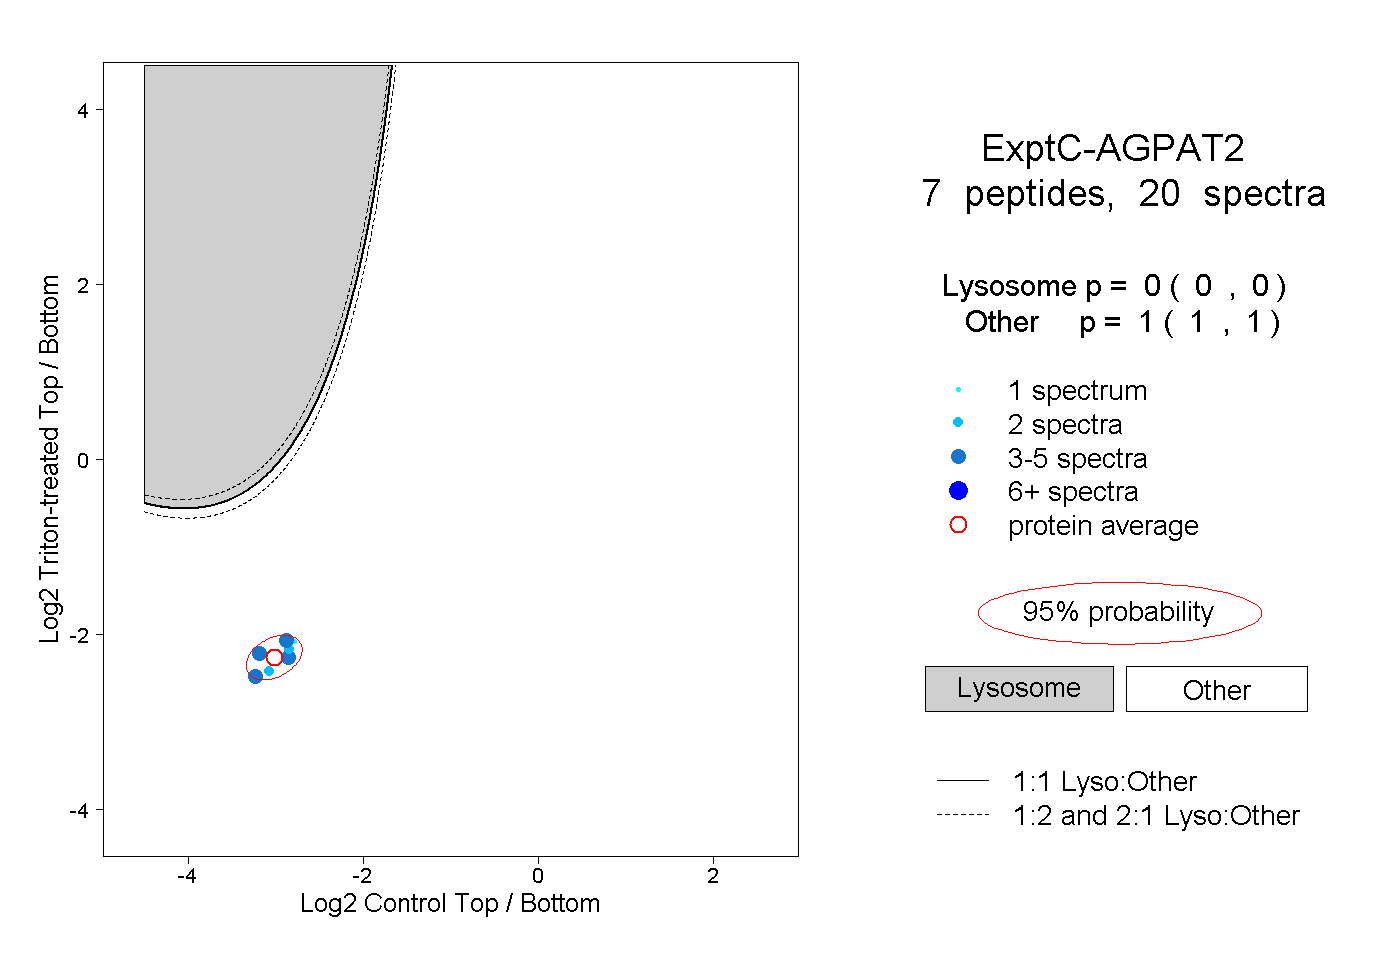 |
0.000 0.000 | 0.000 |
1.000 1.000 | 1.000 |
||||||||
| Plot | Lyso | Other | |||||||||||
| Expt D |
2 peptides |
2 spectra |
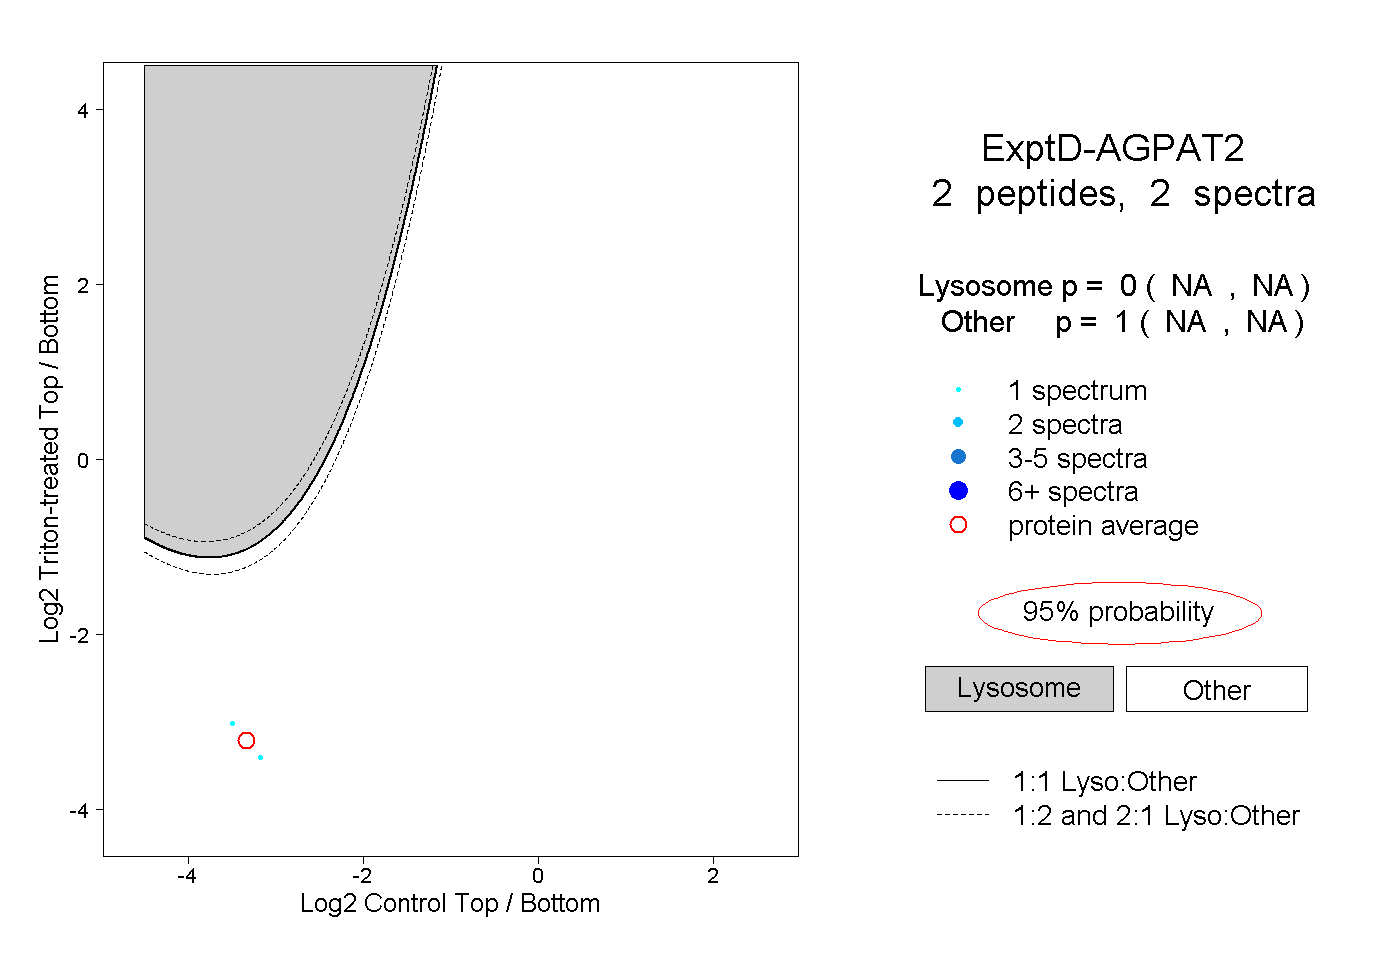 |
0.000 NA | NA |
1.000 NA | NA |