 1
1peptide
spectra
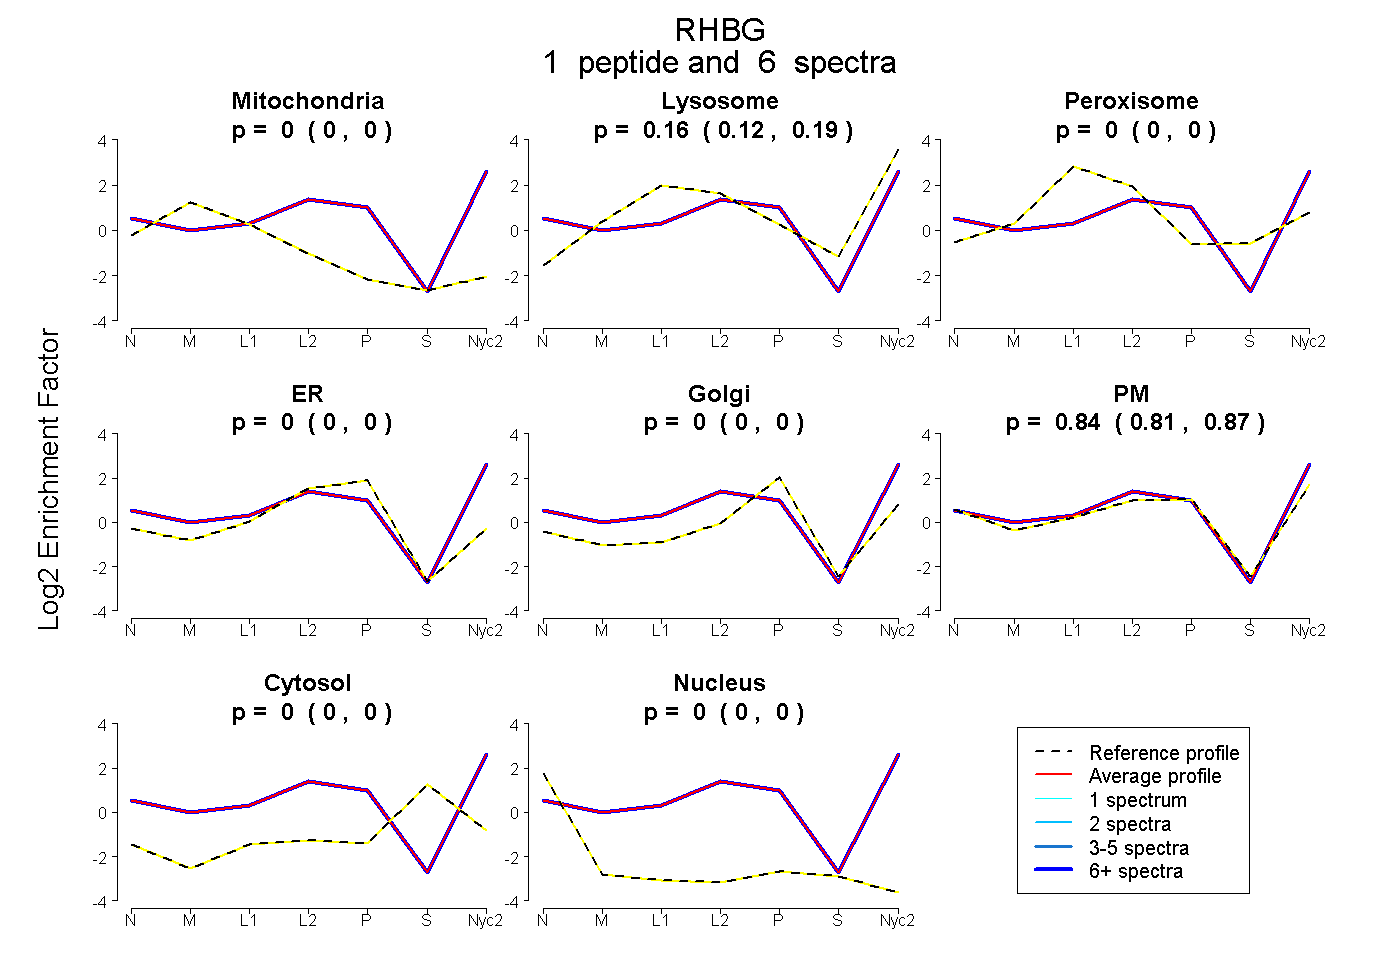
0.000 | 0.000
0.124 | 0.186
0.000 | 0.000
0.000 | 0.000
0.000 | 0.000
0.809 | 0.871
0.000 | 0.000
0.000 | 0.000
1peptide
spectra
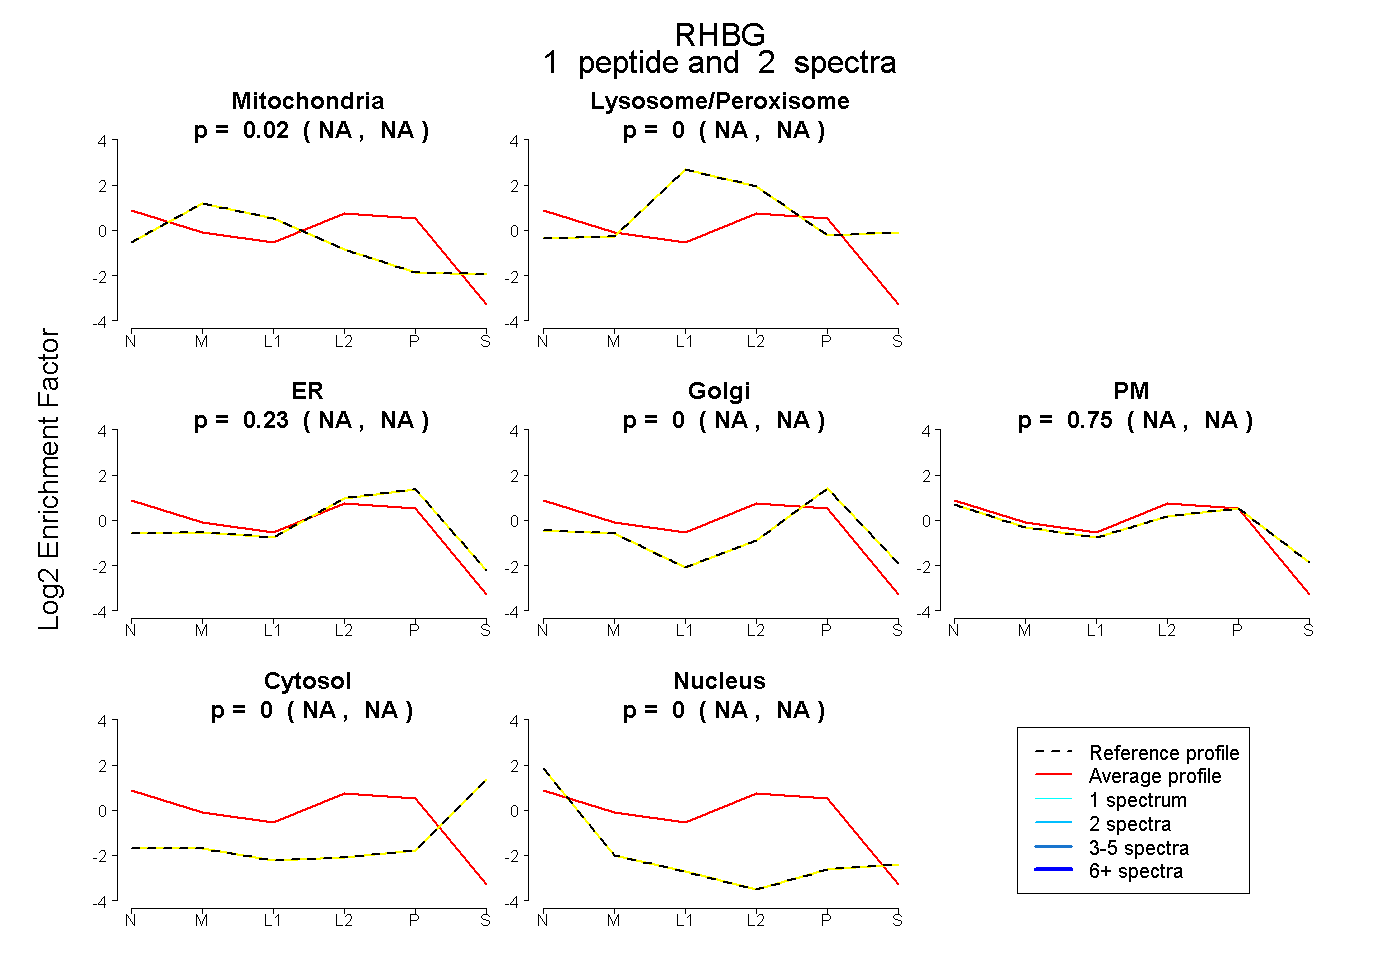
NA | NA
NA | NA
NA | NA
NA | NA
NA | NA
NA | NA
NA | NA
1peptide
spectra
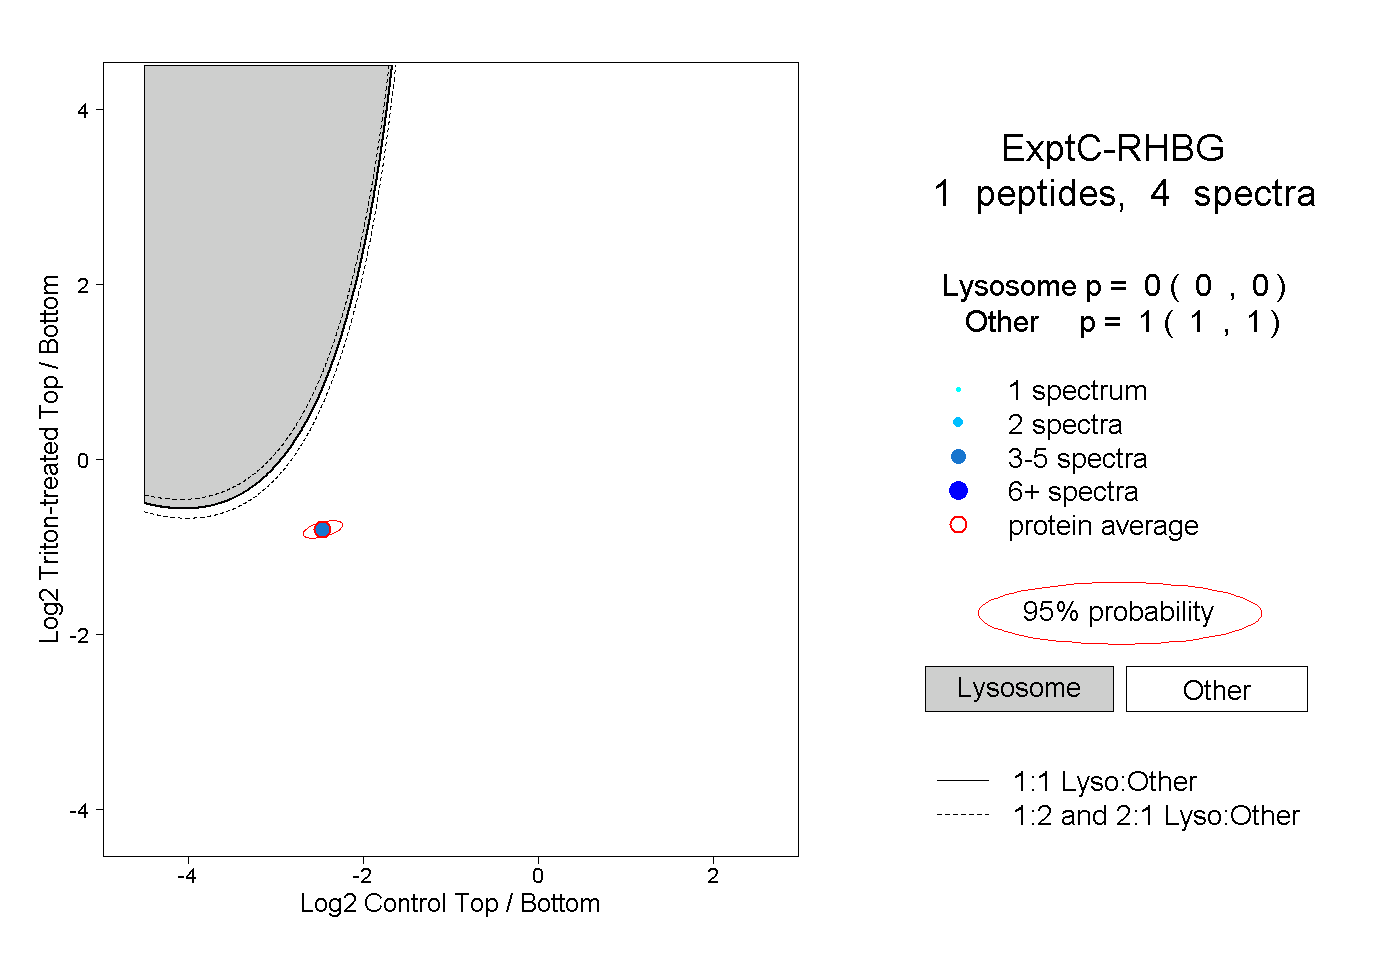
0.000 | 0.000
1.000 | 1.000