 2
2peptides
spectra
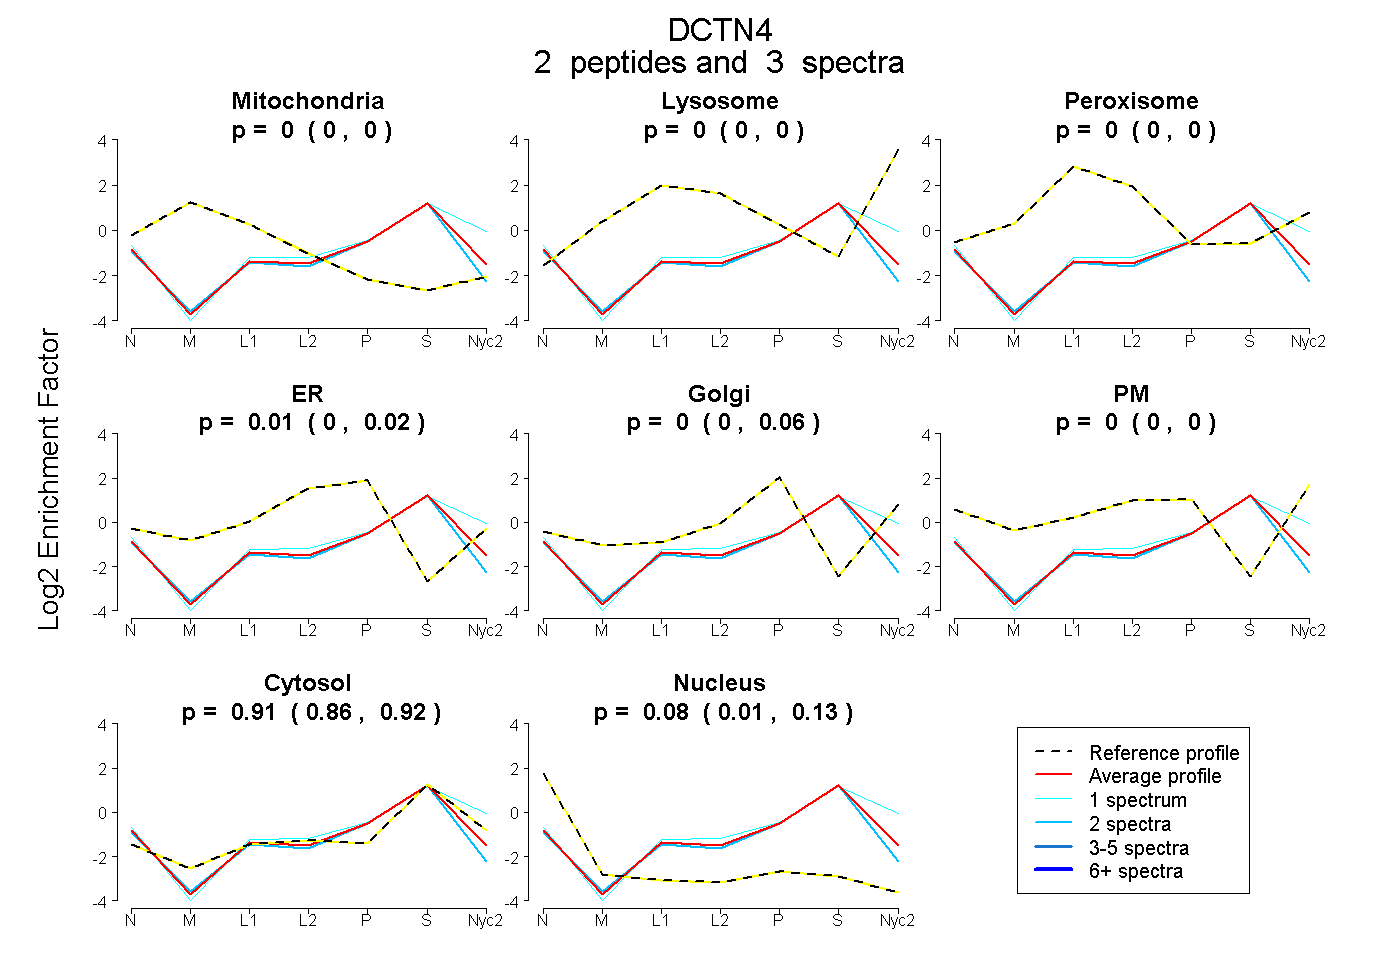
0.000 | 0.000
0.000 | 0.000
0.000 | 0.000
0.000 | 0.024
0.000 | 0.057
0.000 | 0.000
0.863 | 0.923
0.014 | 0.128
5peptides
spectra
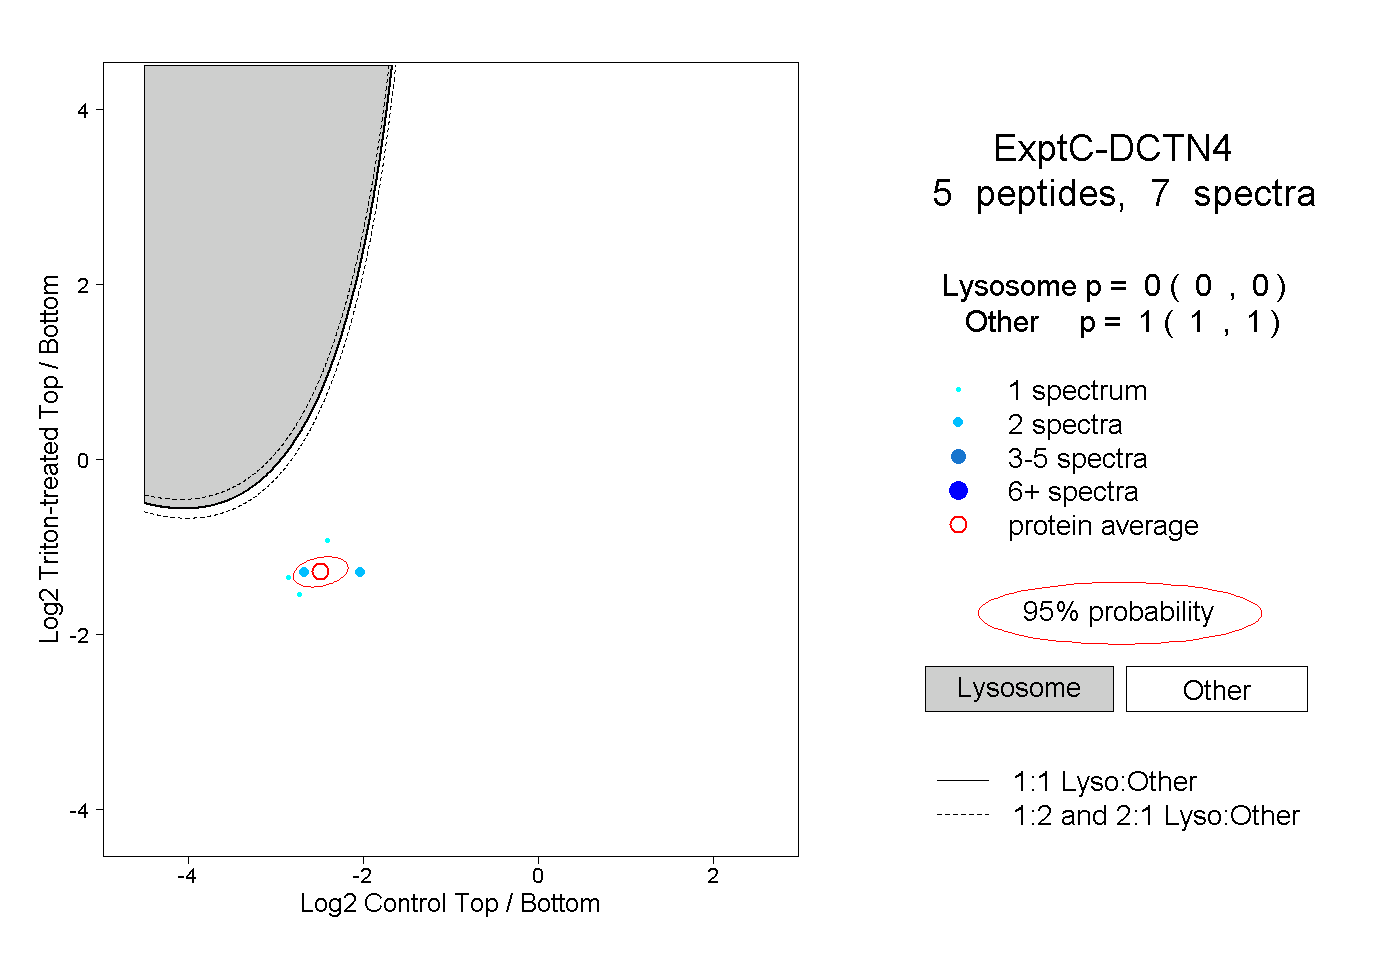
0.000 | 0.000
1.000 | 1.000
1peptide
spectrum
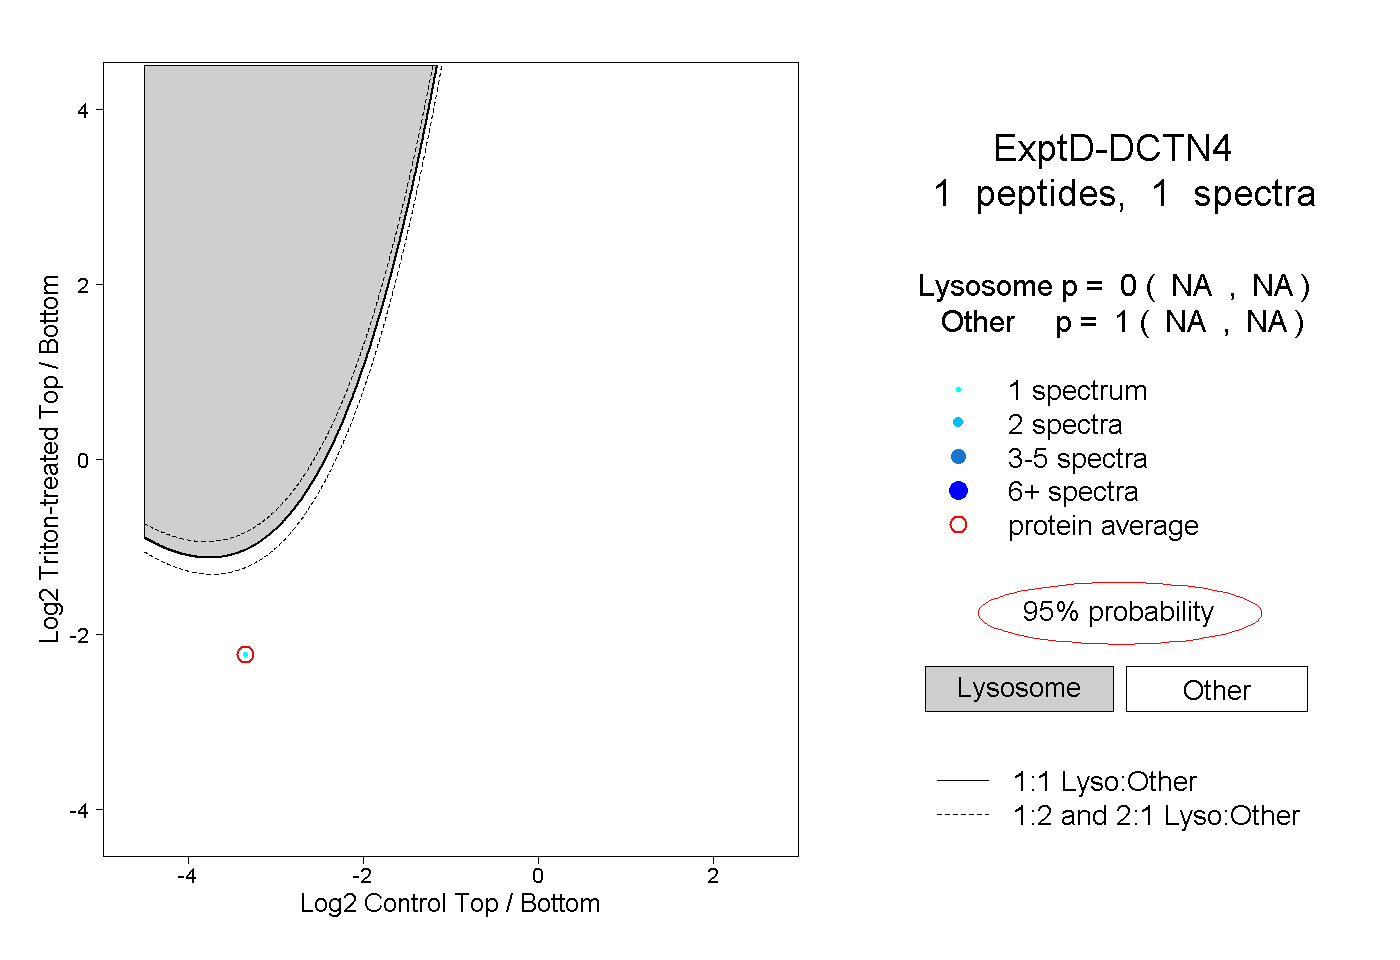
NA | NA
NA | NA