 1
1peptide
spectrum
NA | NA
NA | NA
NA | NA
NA | NA
NA | NA
NA | NA
NA | NA
4peptides
spectra
0.000 | 0.922
0.075 | 1.000
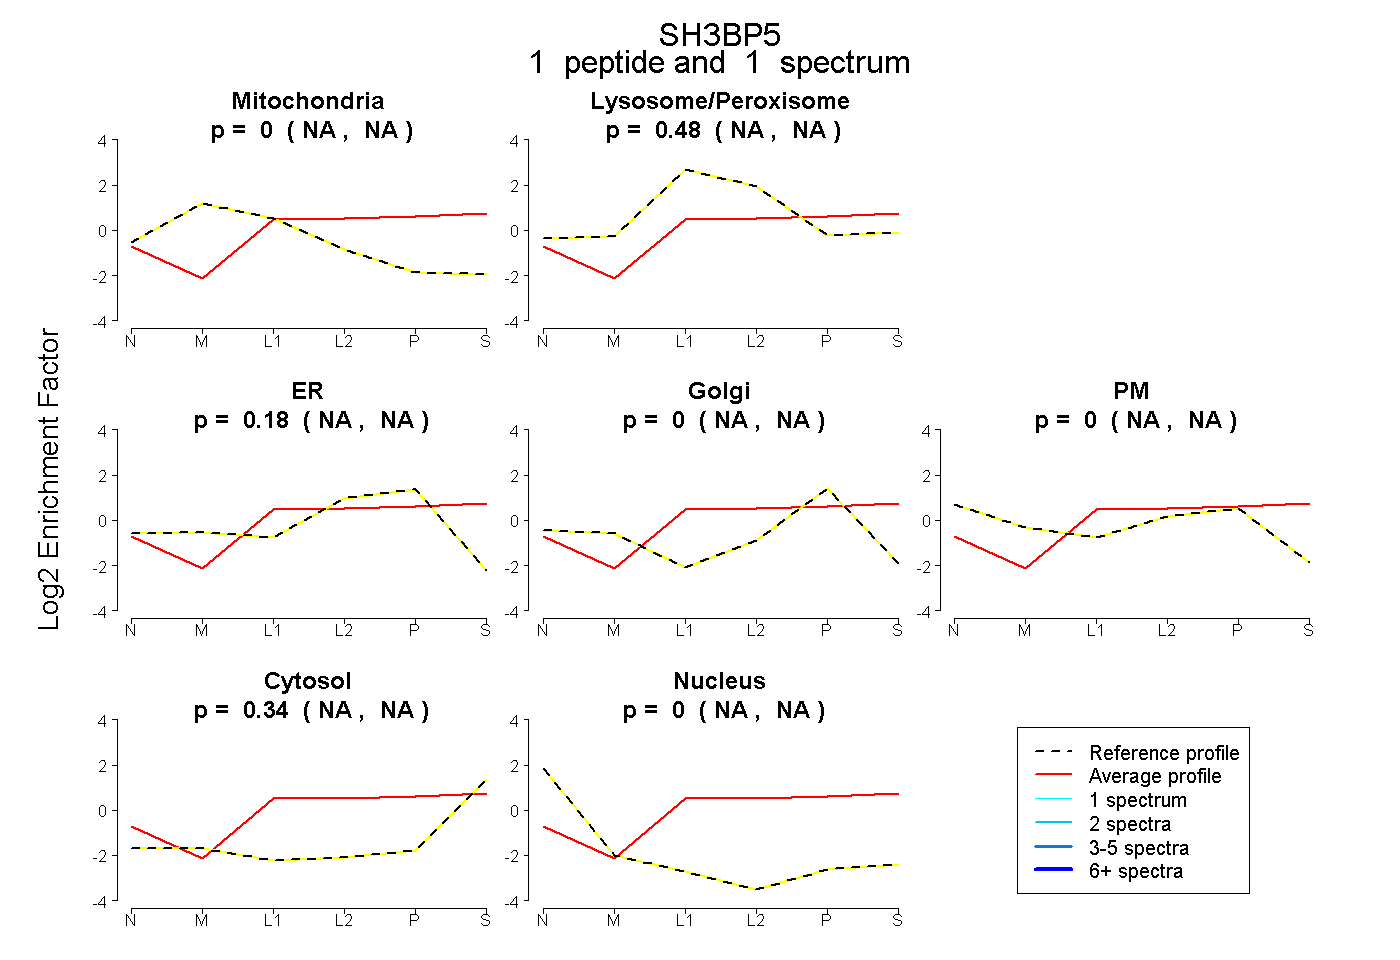
| Plot | Mito | Lyso or Perox | ER | Golgi | PM | Cytosol | Nucleus | ||||||
| Expt B |
1 peptide |
1 spectrum |
|
0.000 NA | NA |
0.476 NA | NA |
0.180 NA | NA |
0.000 NA | NA |
0.000 NA | NA |
0.344 NA | NA |
0.000 NA | NA |
|||
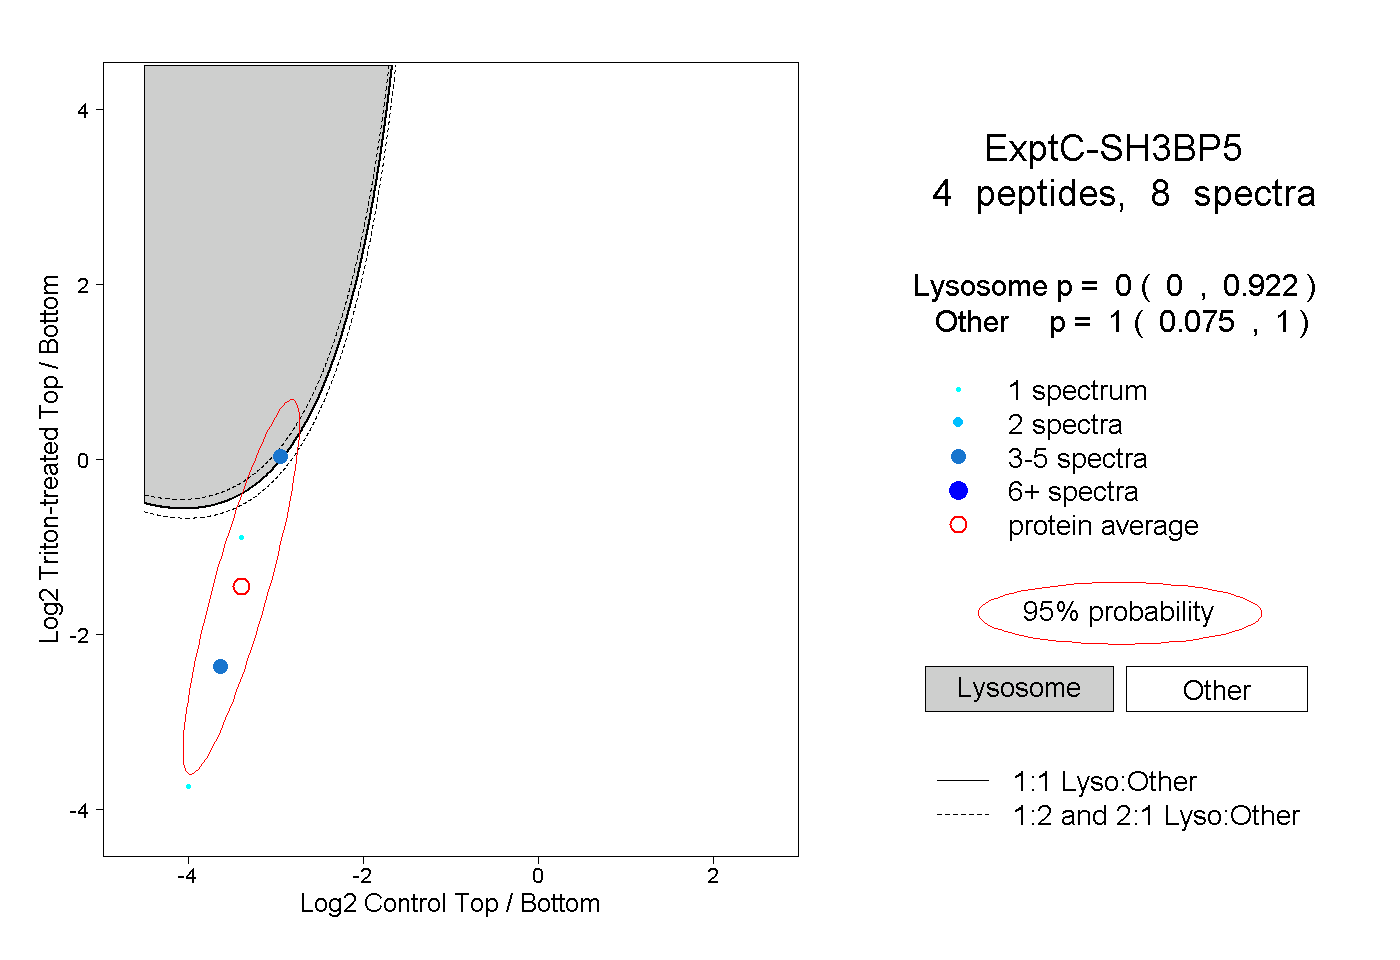
| Plot | Lyso | Other | |||||||||||
| Expt C |
4 peptides |
8 spectra |
|
0.000 0.000 | 0.922 |
1.000 0.075 | 1.000 |