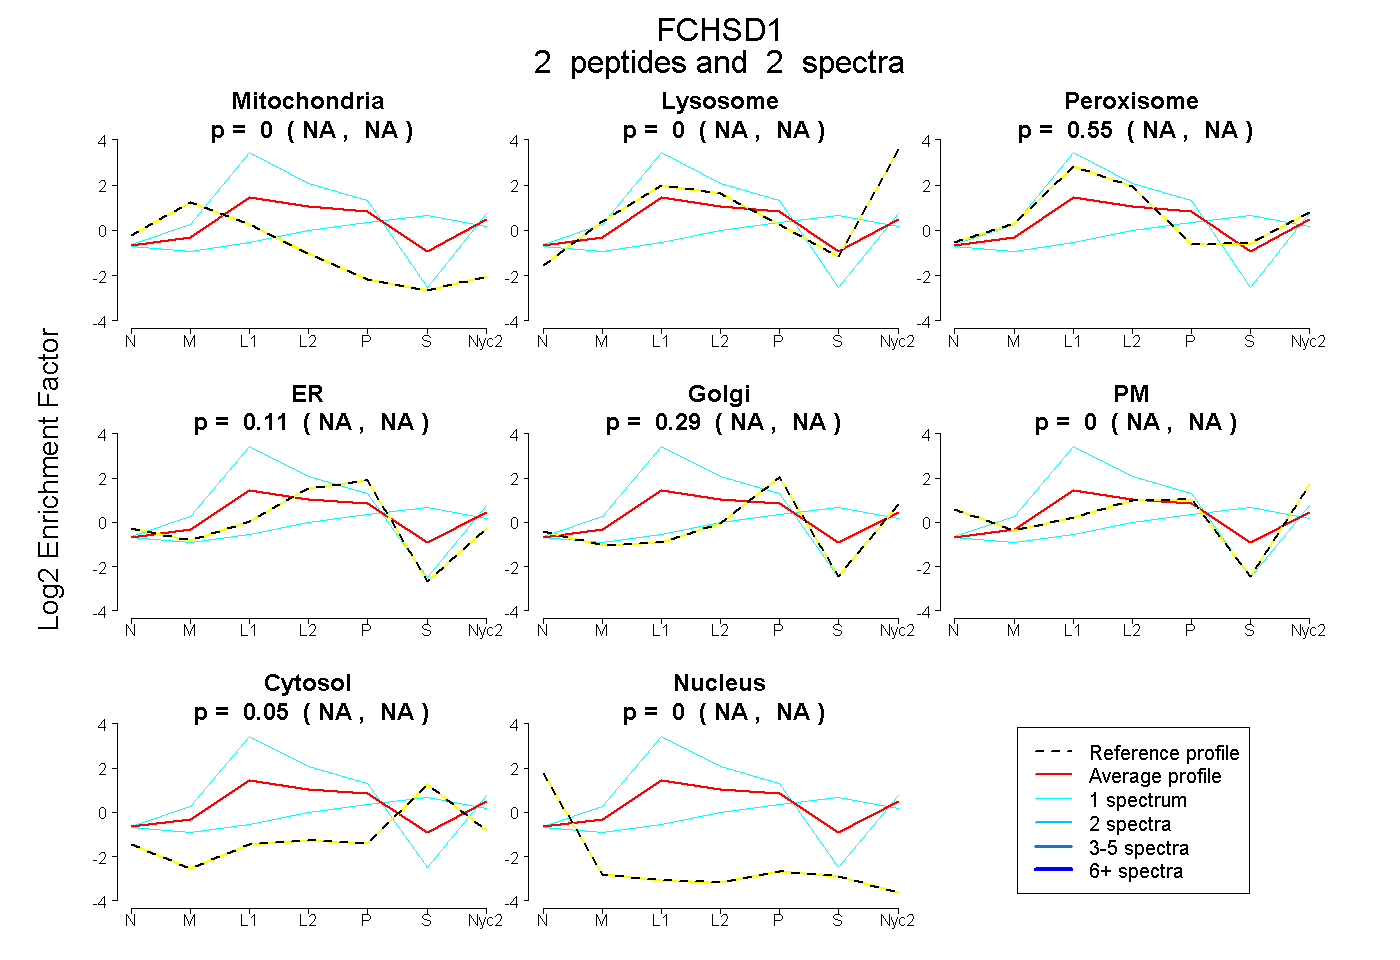
 2
2peptides
spectra
NA | NA
NA | NA
NA | NA
NA | NA
NA | NA
NA | NA
NA | NA
NA | NA
| Plot | Mito | Lyso | Perox | ER | Golgi | PM | Cytosol | Nucleus | |||||
| Expt A |
2 peptides |
2 spectra |
|
0.000 NA | NA |
0.000 NA | NA |
0.553 NA | NA |
0.111 NA | NA |
0.285 NA | NA |
0.000 NA | NA |
0.051 NA | NA |
0.000 NA | NA |
| 1 spectrum, LAGPFLK | 0.000 | 0.128 | 0.545 | 0.327 | 0.000 | 0.000 | 0.000 | 0.000 | ||
| 1 spectrum, EADLLEDIR | 0.000 | 0.062 | 0.189 | 0.000 | 0.262 | 0.000 | 0.487 | 0.000 |
| Plot | Lyso | Other | |||||||||||
| Expt C |
2 peptides |
10 spectra |
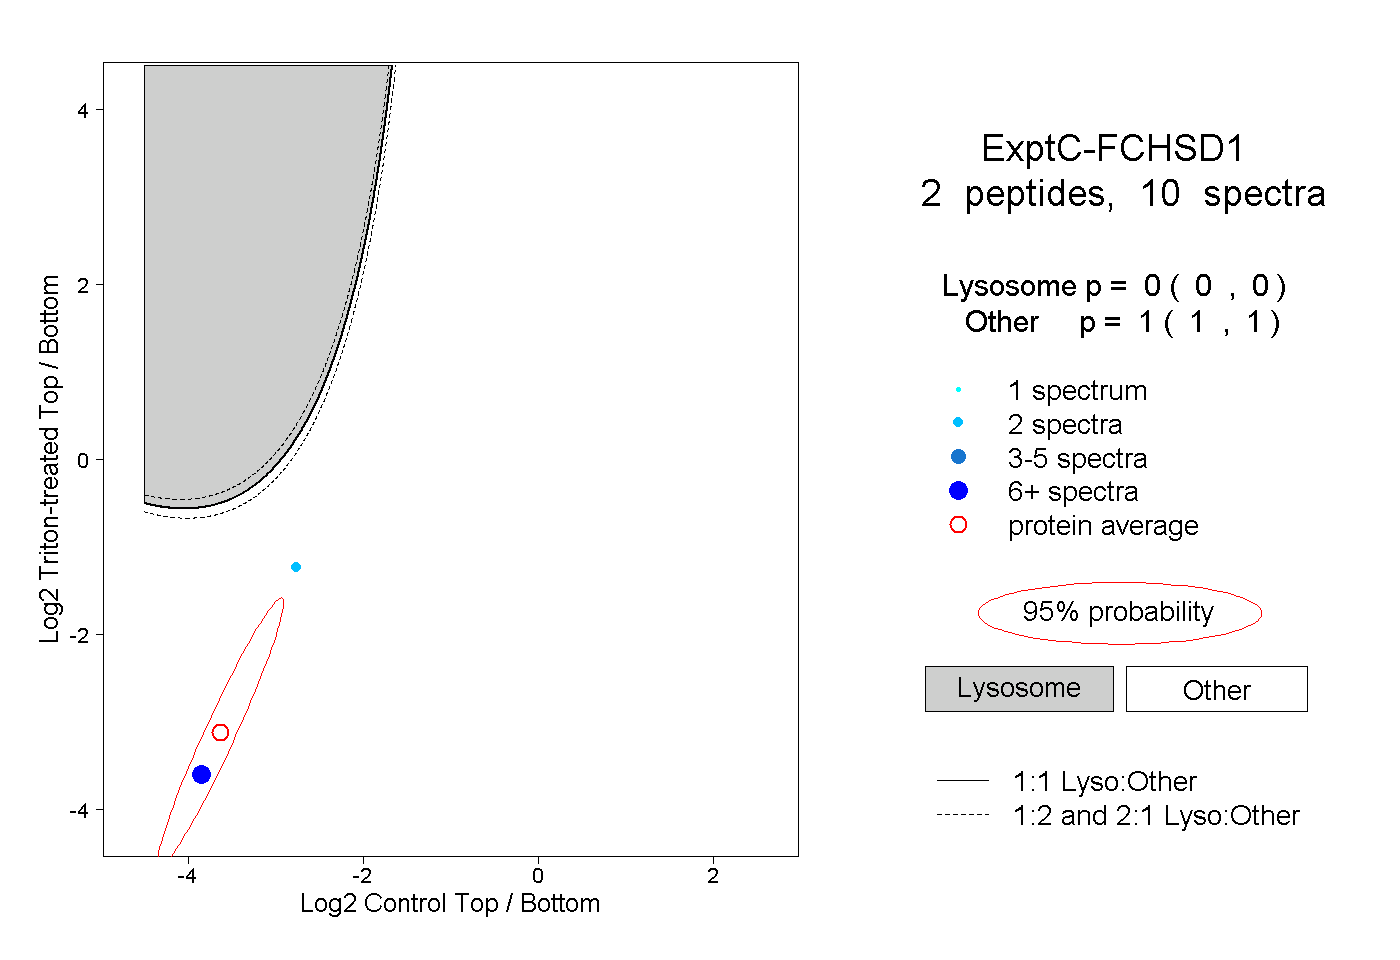 |
0.000 0.000 | 0.000 |
1.000 1.000 | 1.000 |