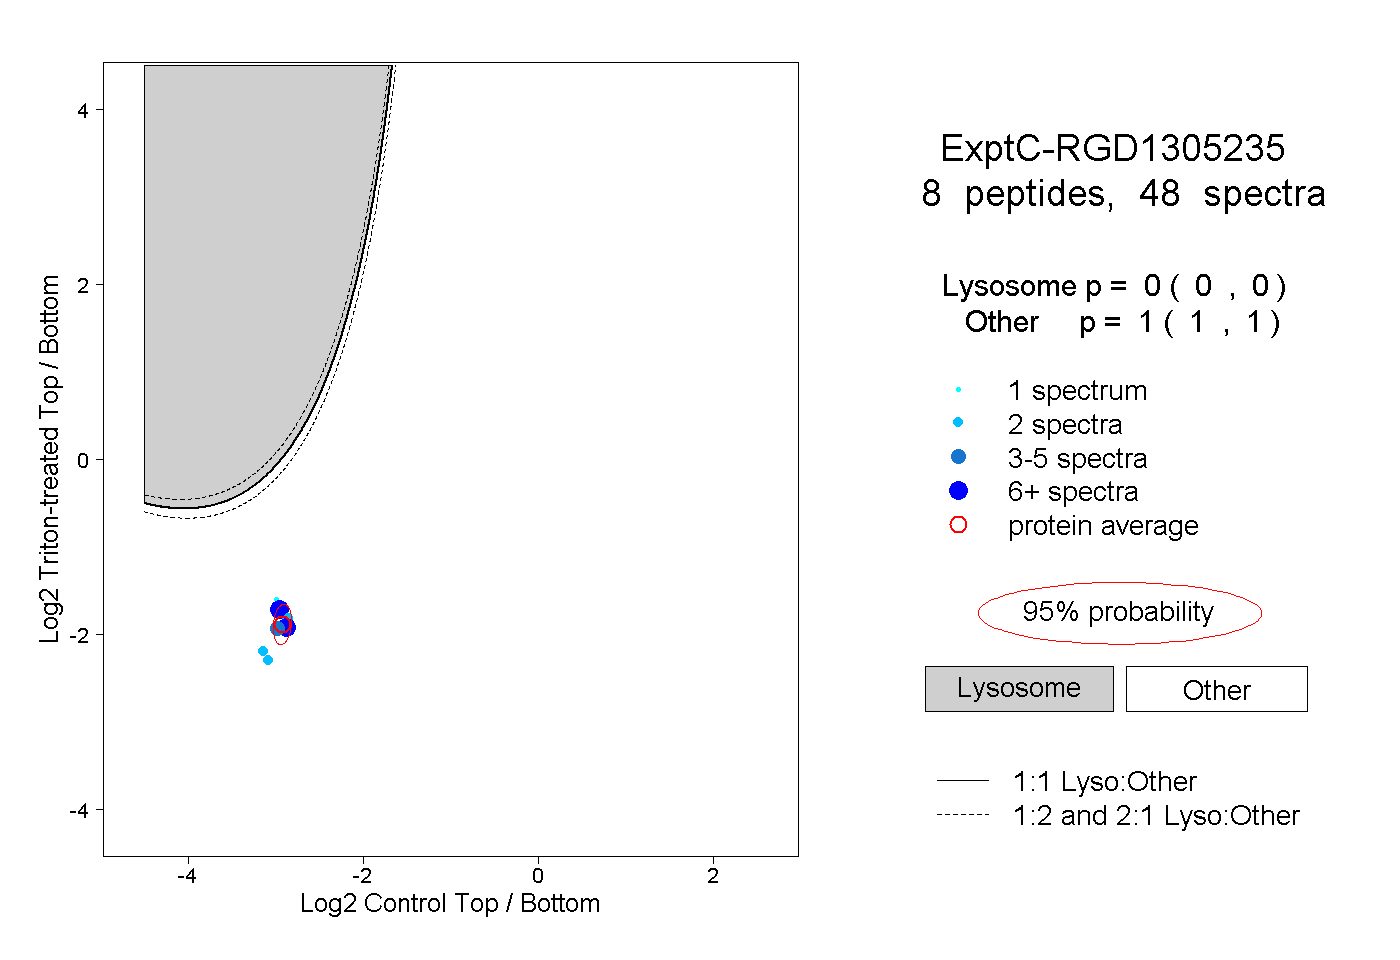
RGD1305235
[ENSRNOP00000026367]
Main page
| | | Plot |
Mito |
Lyso |
|
Perox |
ER |
Golgi |
PM |
Cytosol |
Nucleus |
|
| Expt A |
 7
7
peptides |
15
spectra |
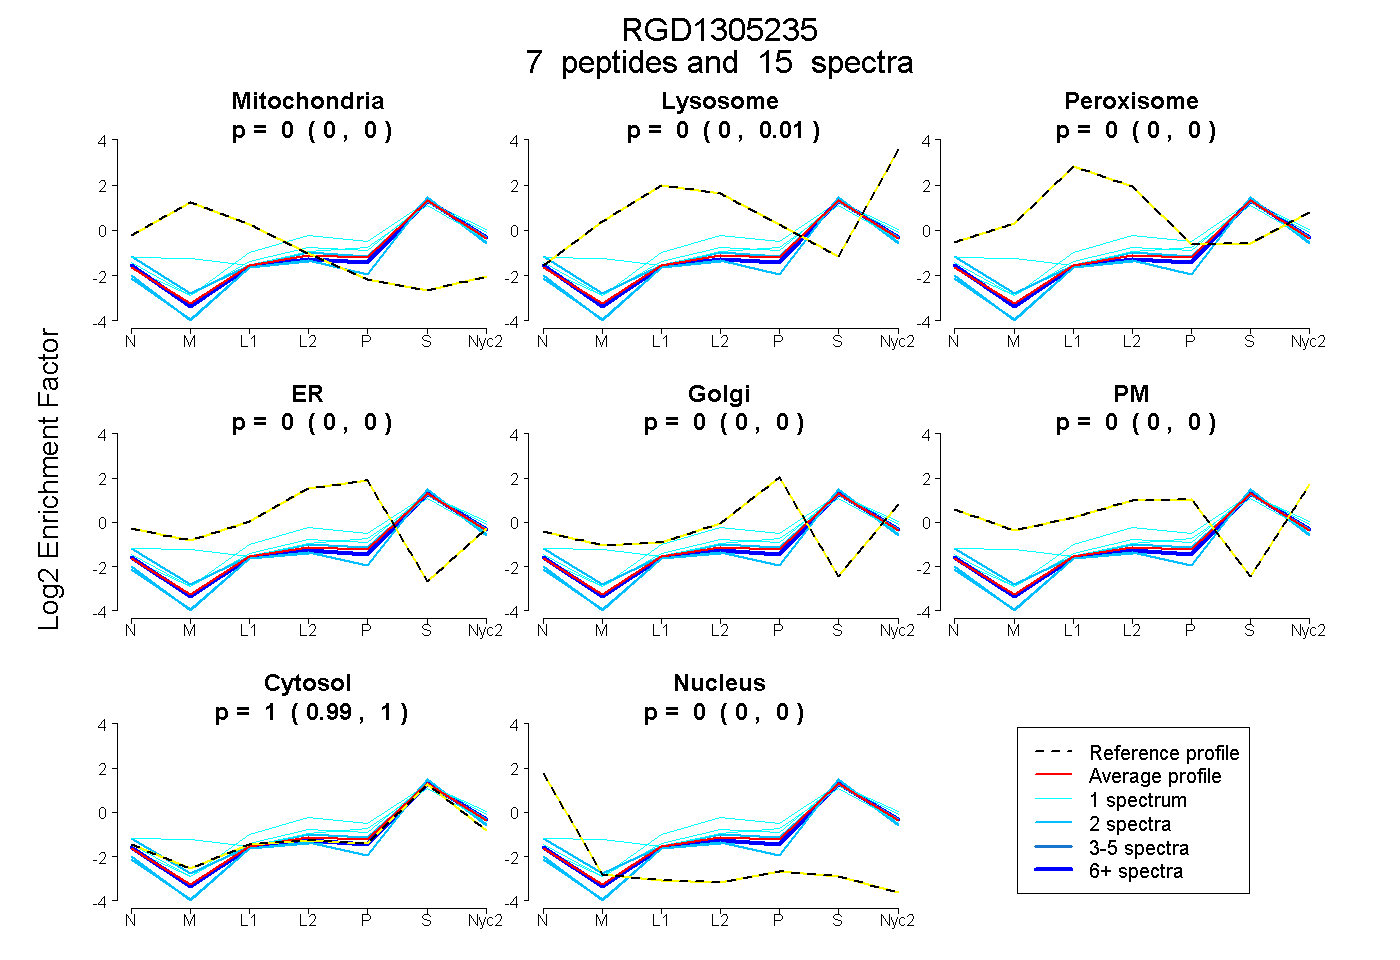 |
0.000
0.000 | 0.000 |
0.005
0.000 | 0.011 |
|
0.000
0.000 | 0.000 |
0.000
0.000 | 0.000 |
0.000
0.000 | 0.003 |
0.000
0.000 | 0.000 |
0.995
0.987 | 1.000 |
0.000
0.000 | 0.000 |
|
| | | Plot |
Mito |
|
Lyso or Perox |
|
ER |
Golgi |
PM |
Cytosol |
Nucleus |
|
| Expt B |
1
peptide |
1
spectrum |
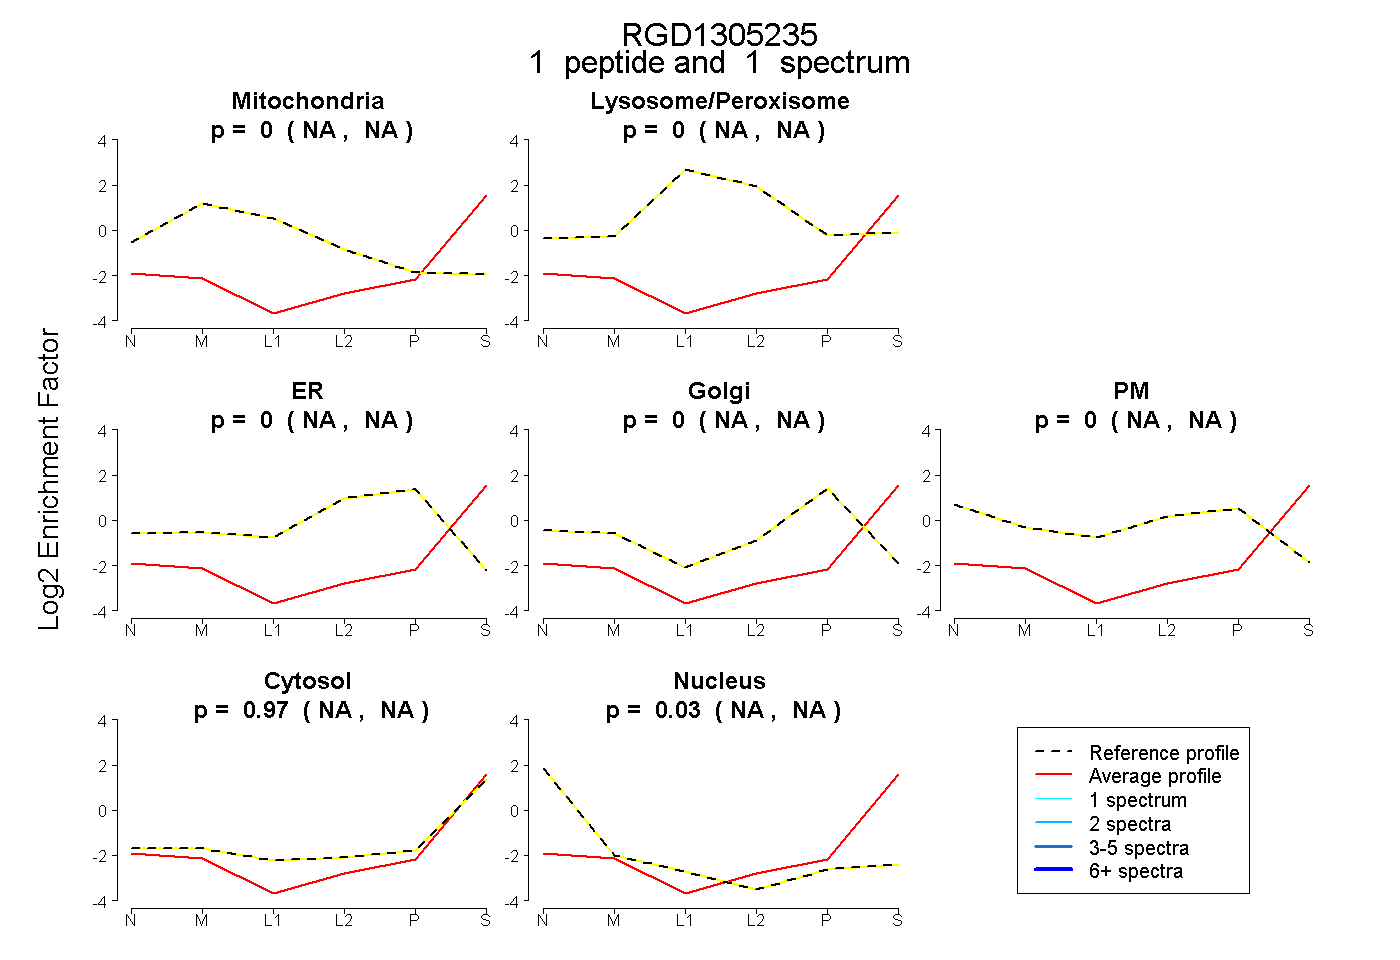 |
0.000
NA | NA |
|
0.000
NA | NA |
|
0.000
NA | NA |
0.000
NA | NA |
0.000
NA | NA |
0.975
NA | NA |
0.025
NA | NA |
|
| | | Plot |
|
Lyso |
|
|
|
|
|
|
|
Other |
| Expt C |
8
peptides |
48
spectra |
 |
|
0.000
0.000 | 0.000 |
|
|
|
|
|
|
|
1.000
1.000 | 1.000 |
| 2 spectra, QIQDEFFK |
|
0.000 |
|
|
|
|
|
|
|
1.000 |
| 3 spectra, VIDTLHR |
|
0.000 |
|
|
|
|
|
|
|
1.000 |
| 1 spectrum, AISLLSK |
|
0.000 |
|
|
|
|
|
|
|
1.000 |
| 2 spectra, ADIINSLK |
|
0.000 |
|
|
|
|
|
|
|
1.000 |
| 26 spectra, TAEPPAVR |
|
0.000 |
|
|
|
|
|
|
|
1.000 |
| 2 spectra, HGEEGVEAEK |
|
0.000 |
|
|
|
|
|
|
|
1.000 |
| 10 spectra, GDLNYR |
|
0.000 |
|
|
|
|
|
|
|
1.000 |
| 2 spectra, DFEWIVEHMK |
|
0.000 |
|
|
|
|
|
|
|
1.000 |