 7
7peptides
spectra
0.000 | 0.000
0.000 | 0.011
0.000 | 0.000
0.000 | 0.000
0.000 | 0.003
0.000 | 0.000
0.987 | 1.000
0.000 | 0.000
| Plot | Mito | Lyso | Perox | ER | Golgi | PM | Cytosol | Nucleus | |||||
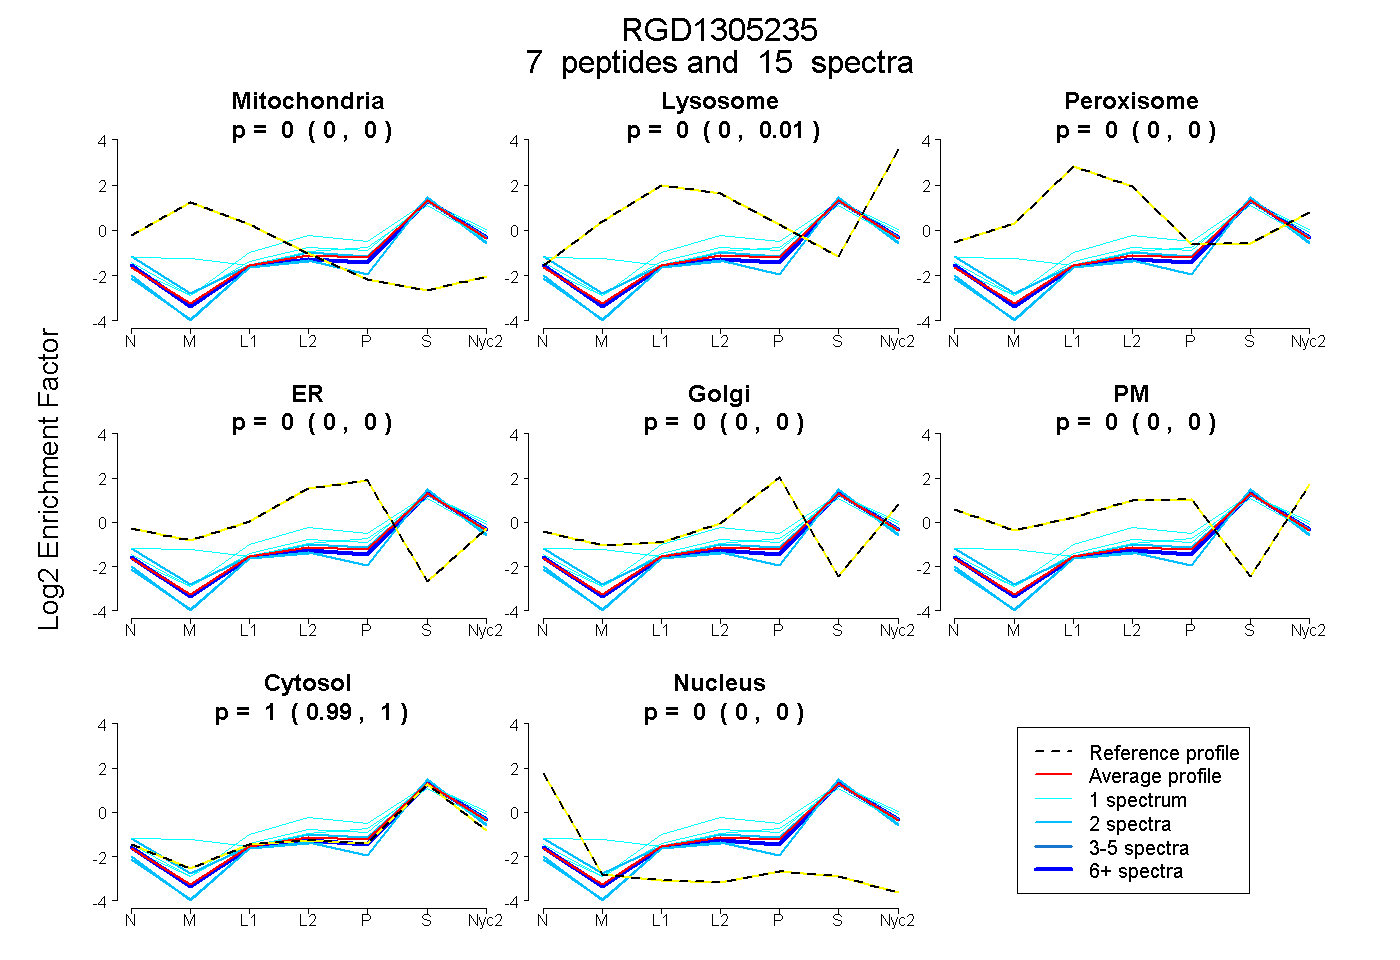
| Expt A |
7 peptides |
15 spectra |
|
0.000 0.000 | 0.000 |
0.005 0.000 | 0.011 |
0.000 0.000 | 0.000 |
0.000 0.000 | 0.000 |
0.000 0.000 | 0.003 |
0.000 0.000 | 0.000 |
0.995 0.987 | 1.000 |
0.000 0.000 | 0.000 |
| 2 spectra, IIPWFVSDVTVR | 0.000 | 0.000 | 0.000 | 0.000 | 0.000 | 0.000 | 1.000 | 0.000 | ||
| 2 spectra, AGVVLFK | 0.000 | 0.000 | 0.000 | 0.000 | 0.000 | 0.000 | 1.000 | 0.000 | ||
| 1 spectrum, VIDTLHR | 0.048 | 0.066 | 0.000 | 0.000 | 0.095 | 0.000 | 0.791 | 0.000 | ||
| 1 spectrum, ADIINSLK | 0.000 | 0.140 | 0.000 | 0.027 | 0.000 | 0.000 | 0.832 | 0.000 | ||
| 1 spectrum, LLQISLWGNK | 0.000 | 0.069 | 0.000 | 0.000 | 0.023 | 0.000 | 0.908 | 0.000 | ||
| 6 spectra, DFEWIVEHMK | 0.000 | 0.000 | 0.000 | 0.000 | 0.000 | 0.000 | 1.000 | 0.000 | ||
| 2 spectra, TAEPPAVR | 0.000 | 0.004 | 0.000 | 0.000 | 0.000 | 0.052 | 0.944 | 0.000 |
| Plot | Mito | Lyso or Perox | ER | Golgi | PM | Cytosol | Nucleus | ||||||
| Expt B |
1 peptide |
1 spectrum |
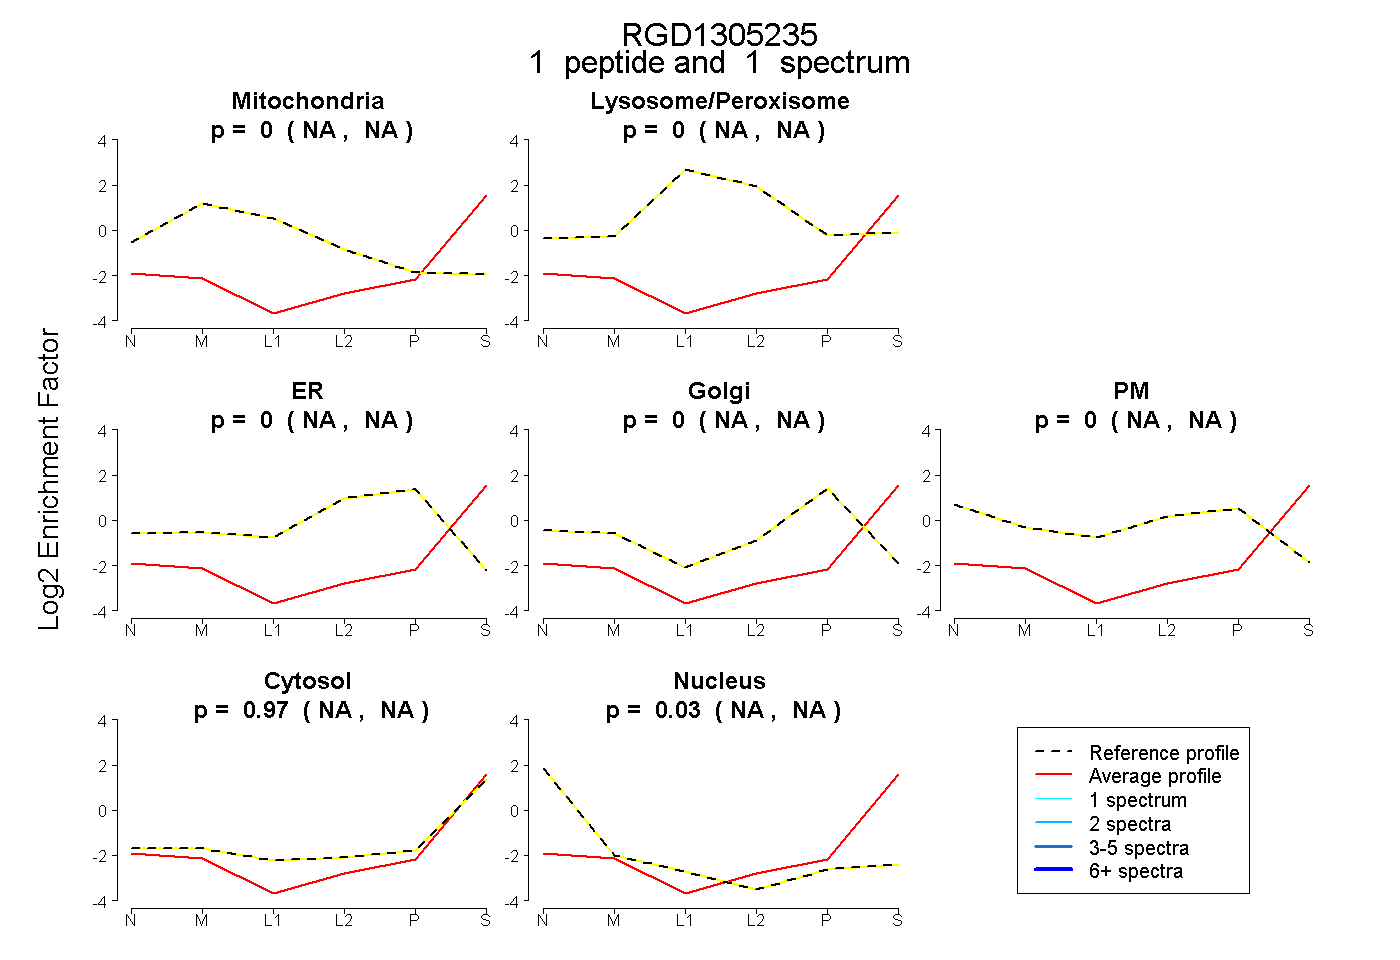 |
0.000 NA | NA |
0.000 NA | NA |
0.000 NA | NA |
0.000 NA | NA |
0.000 NA | NA |
0.975 NA | NA |
0.025 NA | NA |
|||
| Plot | Lyso | Other | |||||||||||
| Expt C |
8 peptides |
48 spectra |
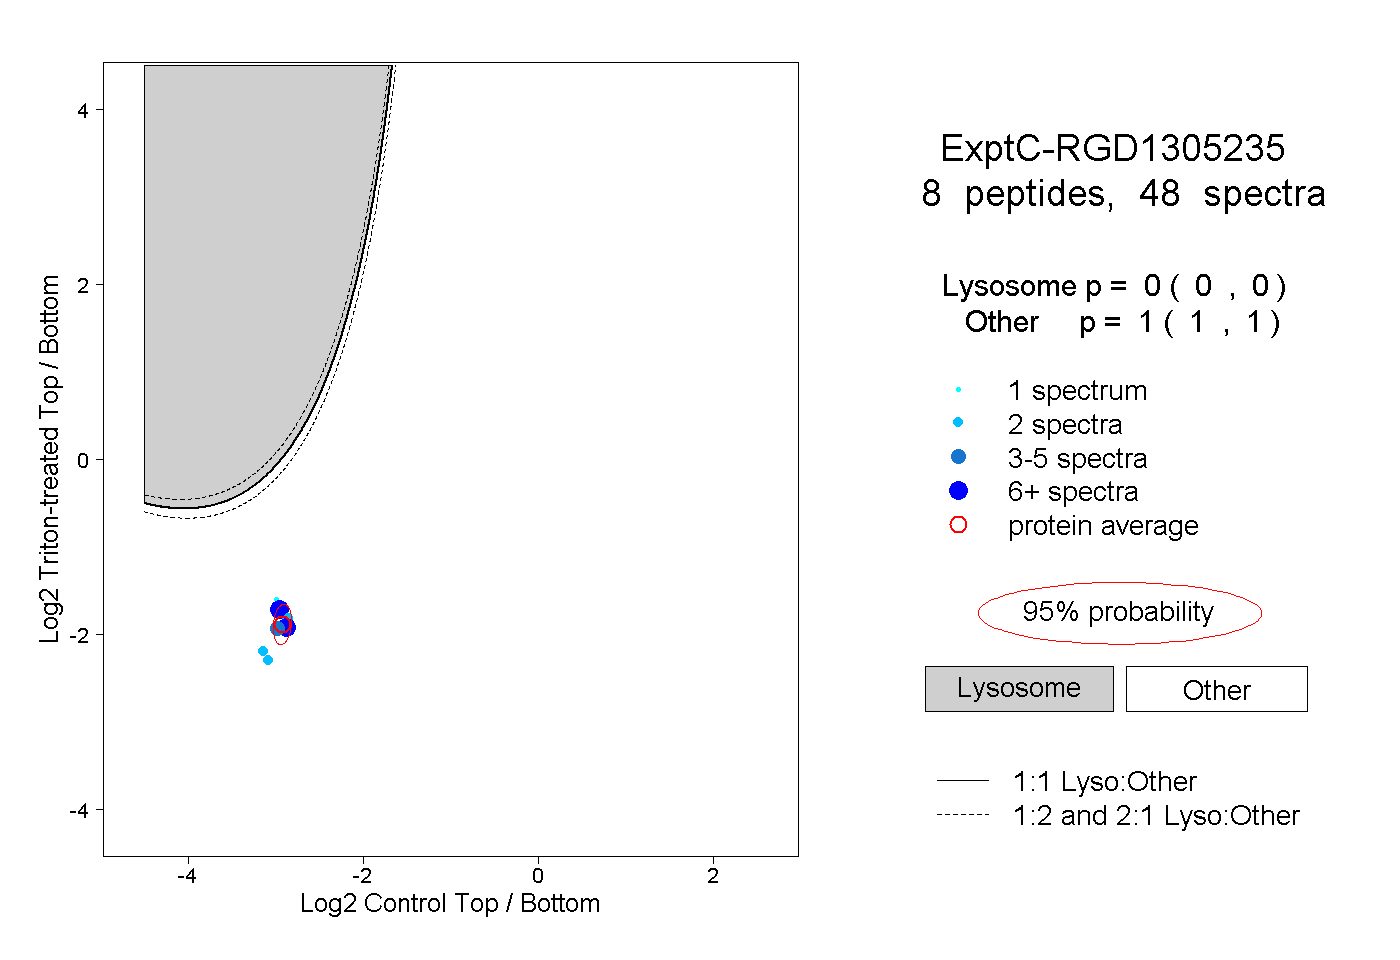 |
0.000 0.000 | 0.000 |
1.000 1.000 | 1.000 |