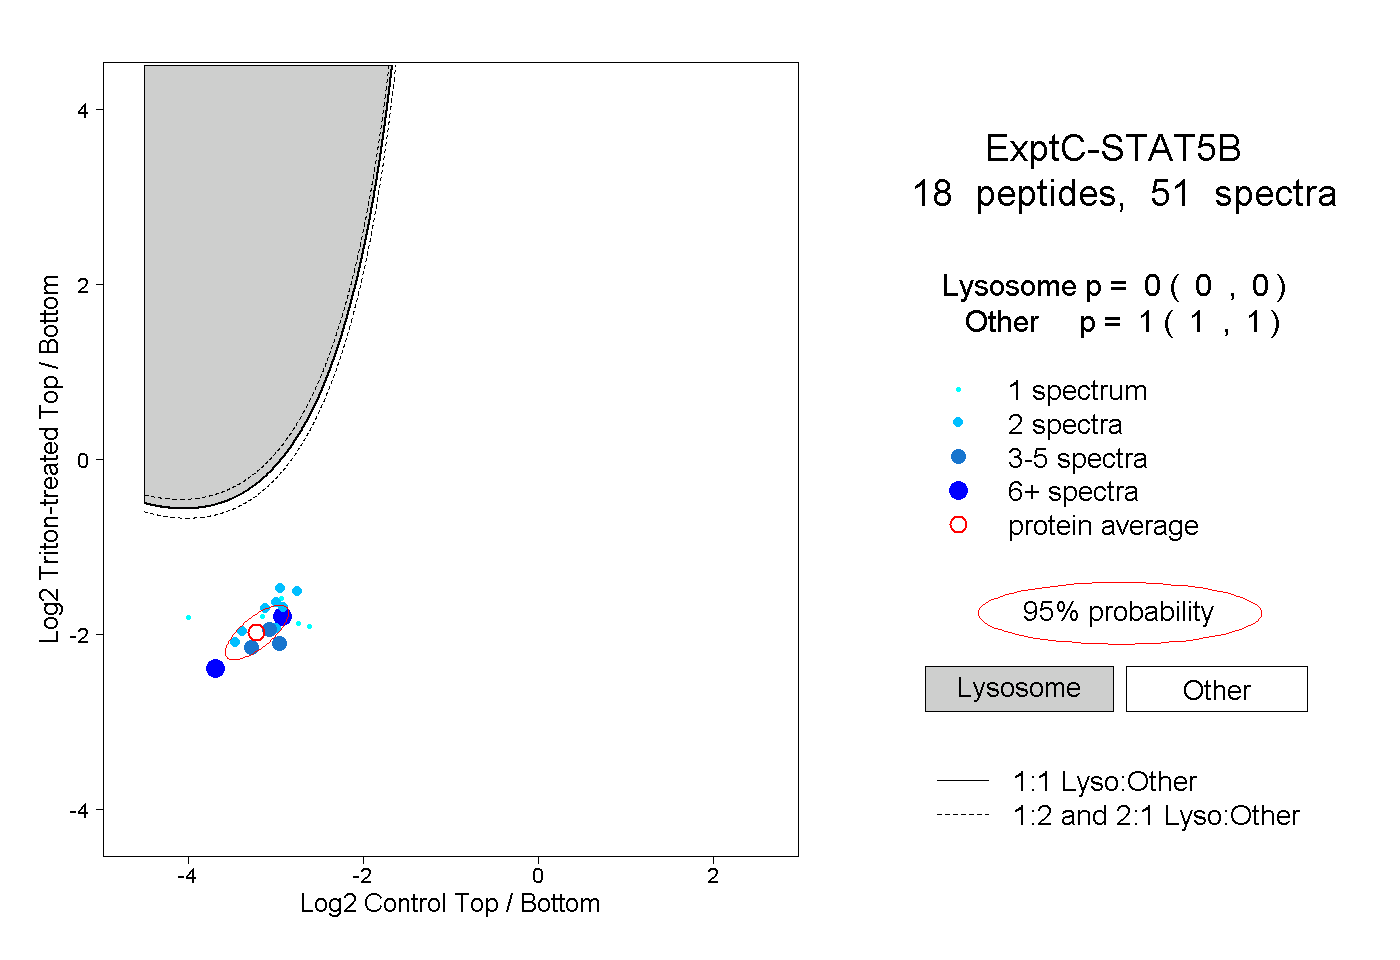
18
18peptides
spectra
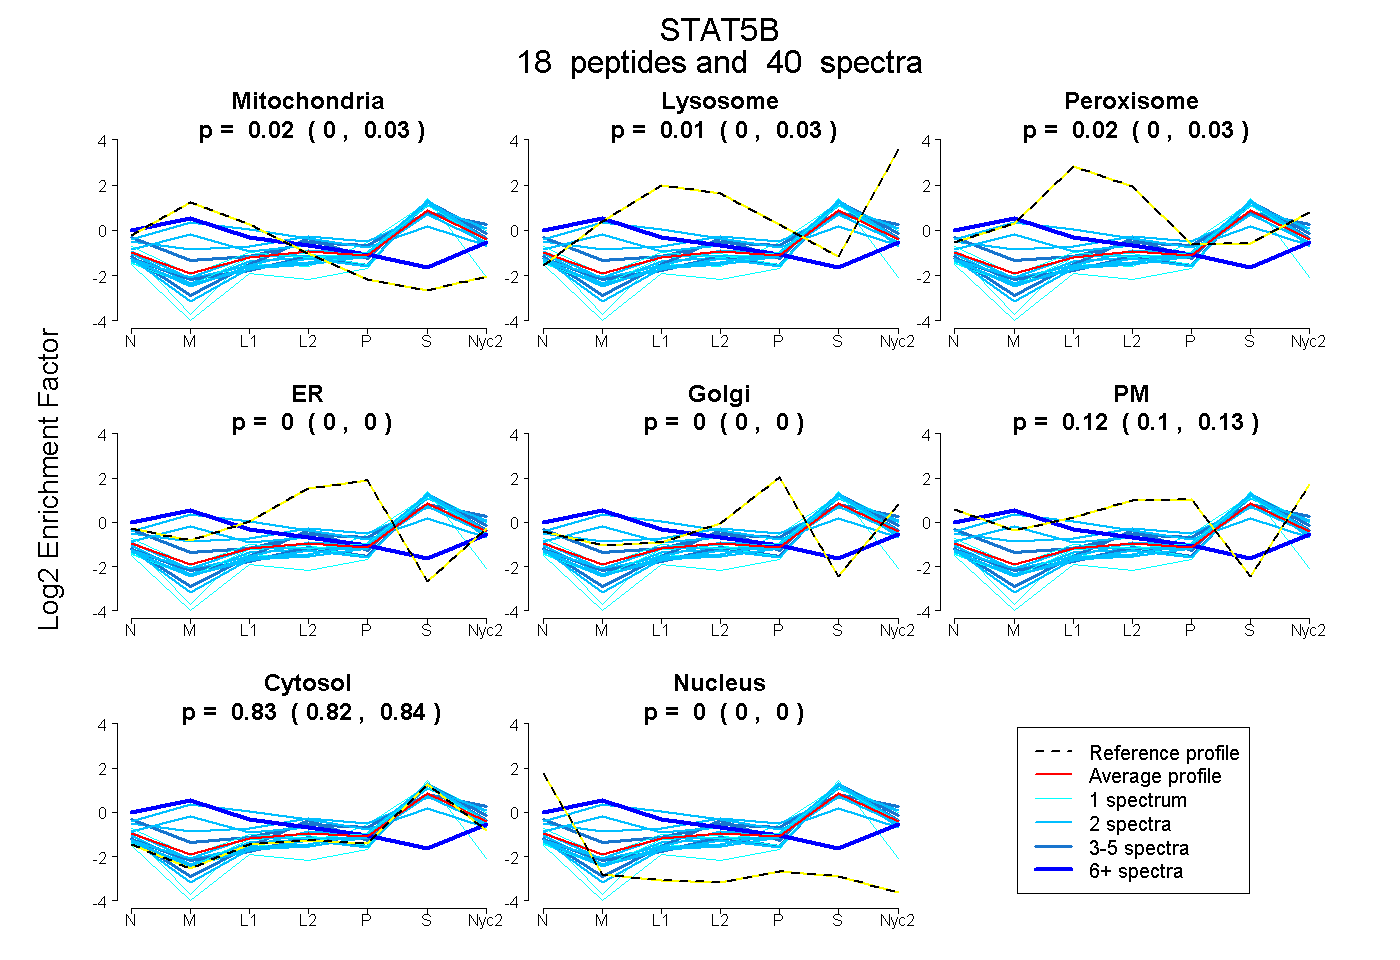
0.004 | 0.034
0.000 | 0.026
0.000 | 0.032
0.000 | 0.000
0.000 | 0.000
0.102 | 0.131
0.819 | 0.843
0.000 | 0.000
6peptides
spectra
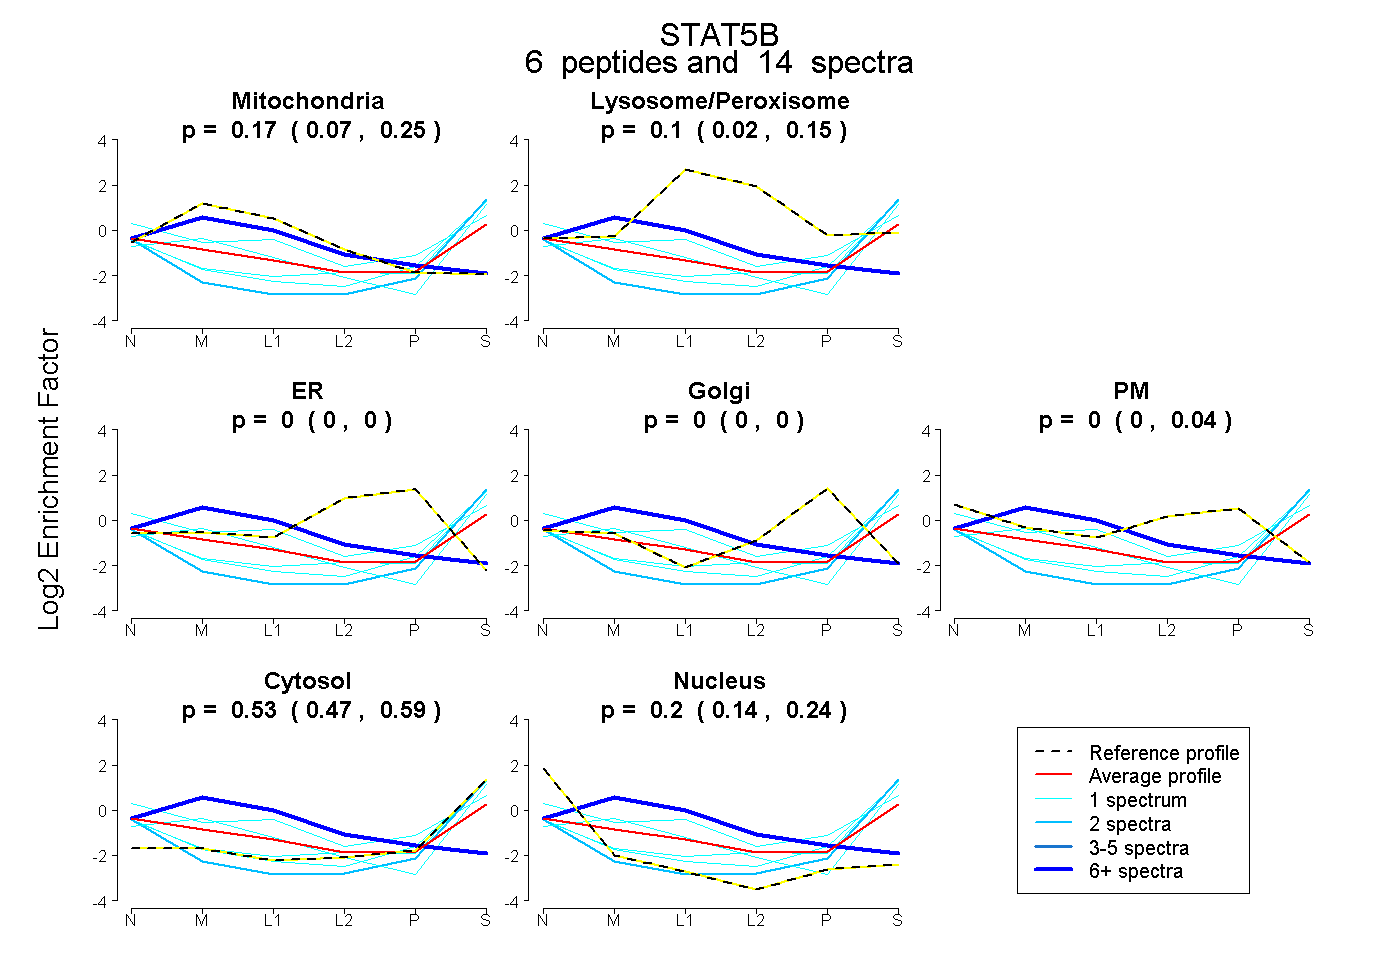
0.068 | 0.251
0.021 | 0.152
0.000 | 0.000
0.000 | 0.000
0.000 | 0.040
0.467 | 0.592
0.144 | 0.242