8
8peptides
spectra
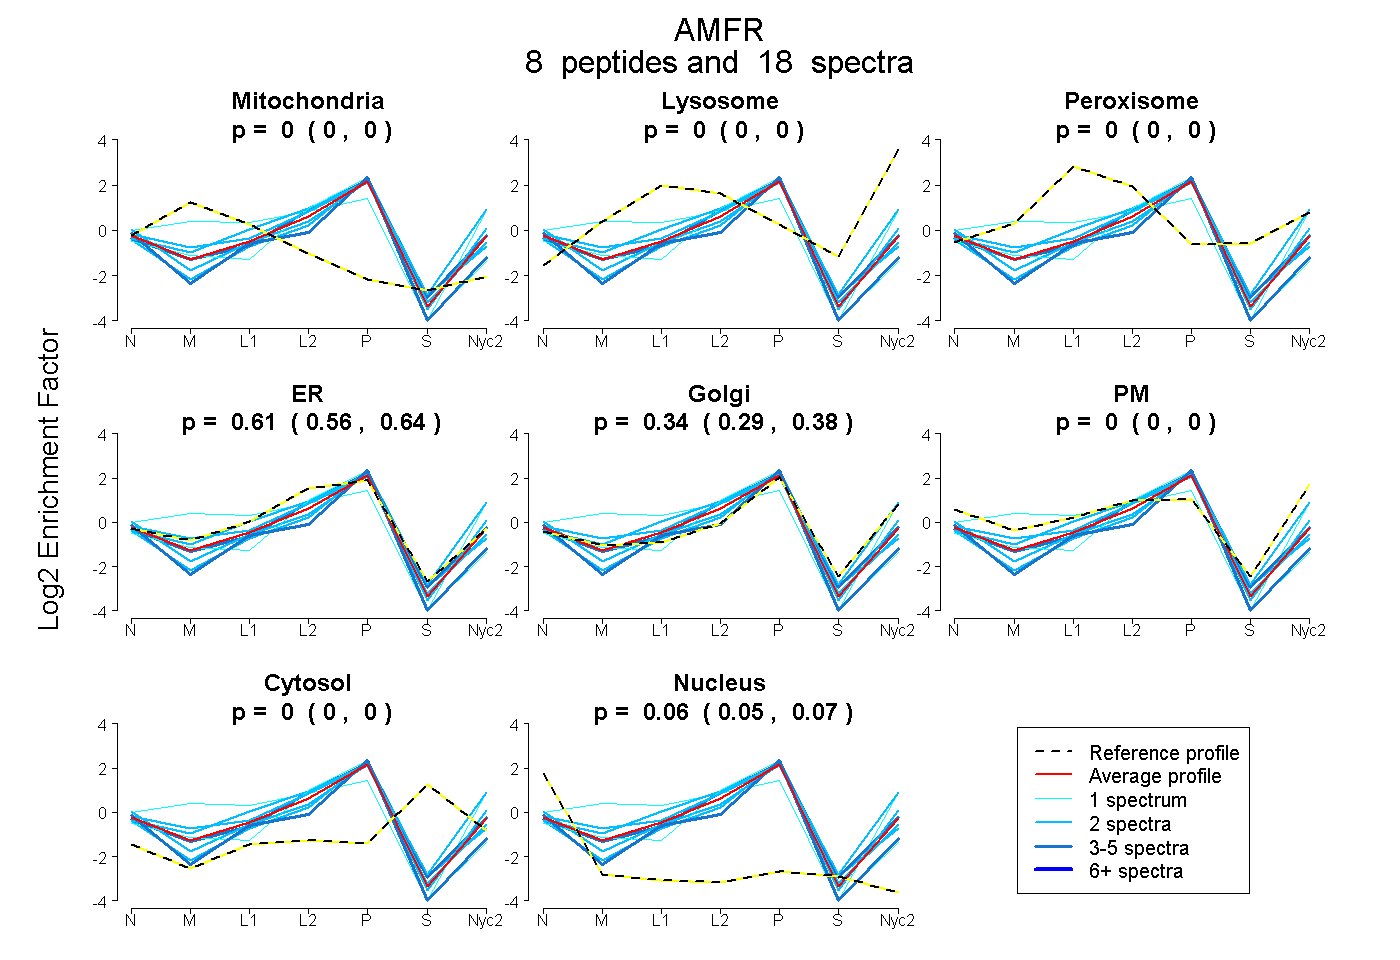
0.000 | 0.000
0.000 | 0.000
0.000 | 0.000
0.563 | 0.644
0.287 | 0.377
0.000 | 0.000
0.000 | 0.000
0.045 | 0.067
5peptides
spectra
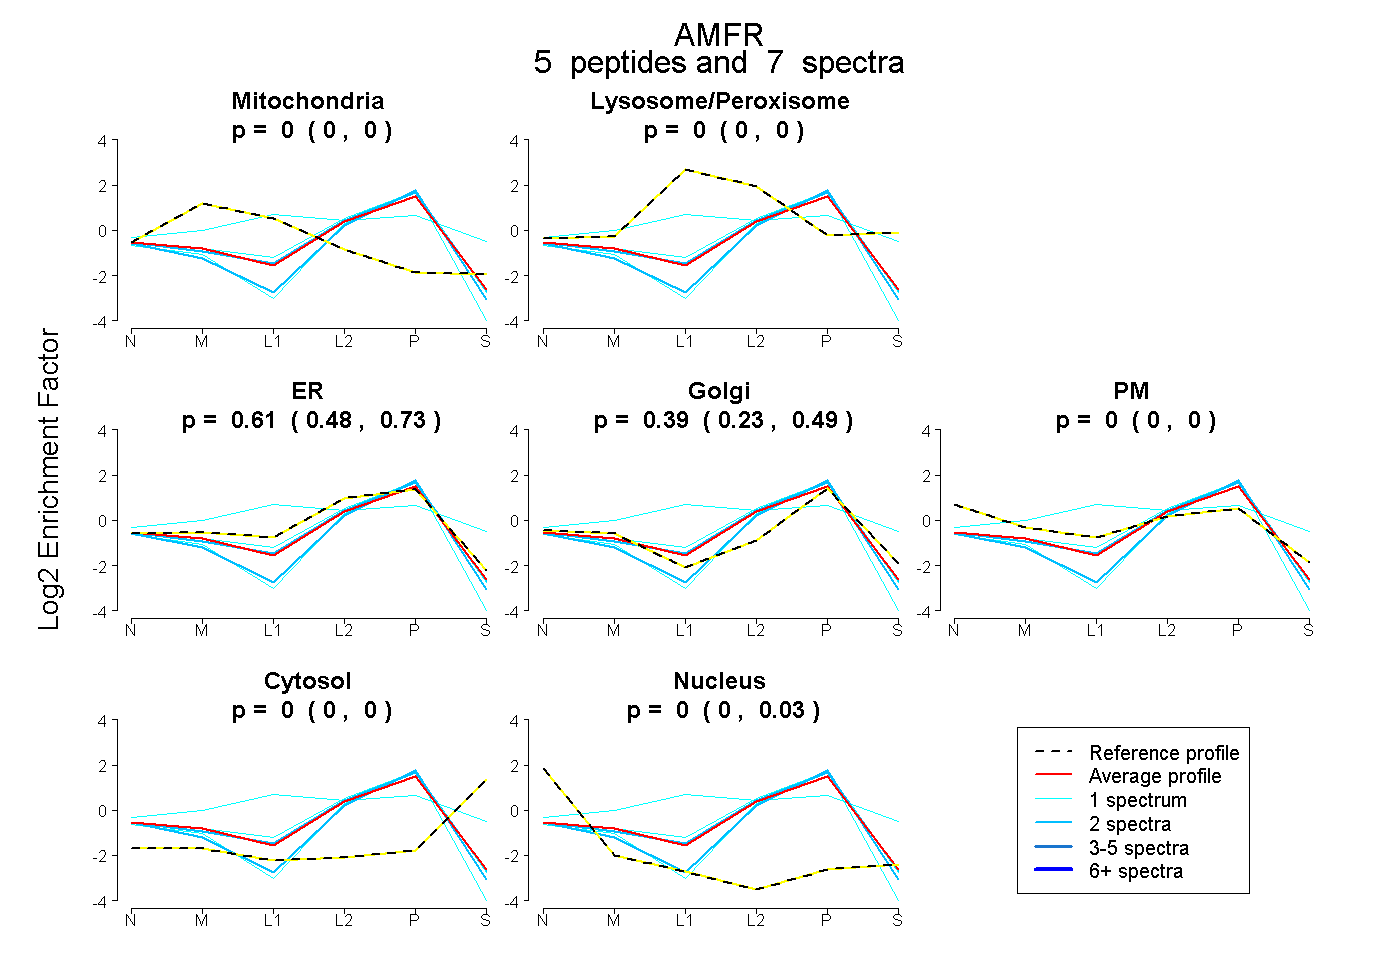
0.000 | 0.000
0.000 | 0.000
0.480 | 0.730
0.228 | 0.495
0.000 | 0.000
0.000 | 0.000
0.000 | 0.026