 8
8peptides
spectra
0.000 | 0.000
0.000 | 0.000
0.000 | 0.000
0.563 | 0.644
0.287 | 0.377
0.000 | 0.000
0.000 | 0.000
0.045 | 0.067
| Plot | Mito | Lyso | Perox | ER | Golgi | PM | Cytosol | Nucleus | |||||
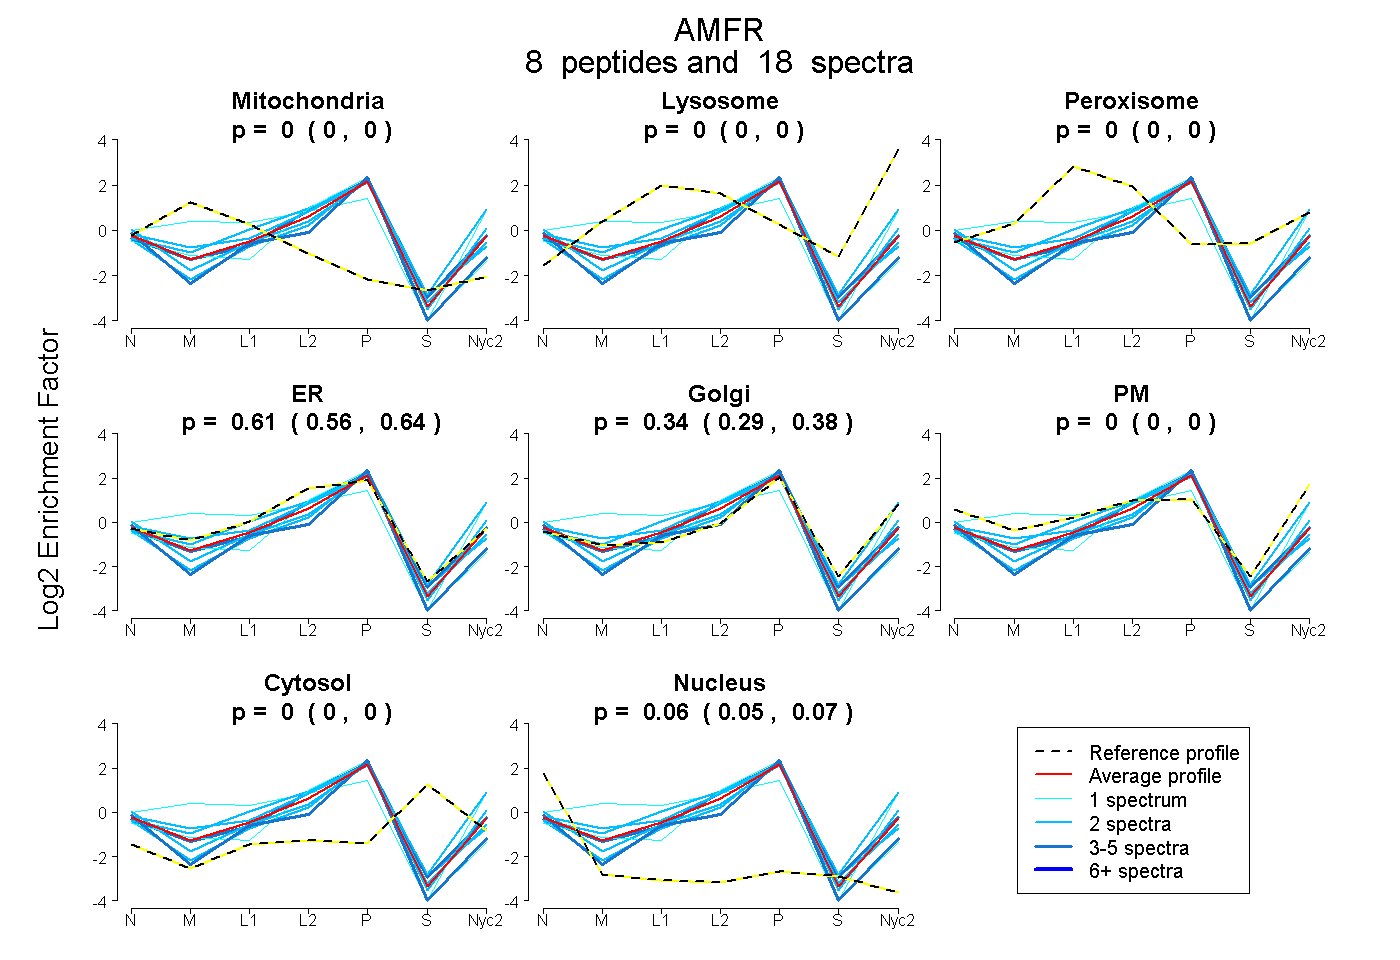
| Expt A |
8 peptides |
18 spectra |
|
0.000 0.000 | 0.000 |
0.000 0.000 | 0.000 |
0.000 0.000 | 0.000 |
0.607 0.563 | 0.644 |
0.336 0.287 | 0.377 |
0.000 0.000 | 0.000 |
0.000 0.000 | 0.000 |
0.057 0.045 | 0.067 |
| 2 spectra, SVEITTDNILEGR | 0.000 | 0.000 | 0.000 | 0.566 | 0.327 | 0.000 | 0.000 | 0.107 | ||
| 1 spectrum, LLPSEGTSSDPVTLR | 0.096 | 0.000 | 0.000 | 0.332 | 0.000 | 0.572 | 0.000 | 0.000 | ||
| 4 spectra, VPLDLSPR | 0.000 | 0.000 | 0.000 | 0.566 | 0.254 | 0.000 | 0.000 | 0.180 | ||
| 4 spectra, LTPGGPR | 0.000 | 0.000 | 0.000 | 0.619 | 0.345 | 0.000 | 0.000 | 0.035 | ||
| 2 spectra, TAHVILR | 0.000 | 0.000 | 0.000 | 0.646 | 0.344 | 0.000 | 0.000 | 0.010 | ||
| 1 spectrum, SWLEQDTSCPTCR | 0.000 | 0.000 | 0.000 | 0.871 | 0.003 | 0.000 | 0.000 | 0.125 | ||
| 2 spectra, IQVPFPVQR | 0.000 | 0.000 | 0.000 | 0.468 | 0.420 | 0.000 | 0.000 | 0.112 | ||
| 2 spectra, MSLNIADGSR | 0.000 | 0.072 | 0.000 | 0.431 | 0.390 | 0.107 | 0.000 | 0.000 |
| Plot | Mito | Lyso or Perox | ER | Golgi | PM | Cytosol | Nucleus | ||||||
| Expt B |
5 peptides |
7 spectra |
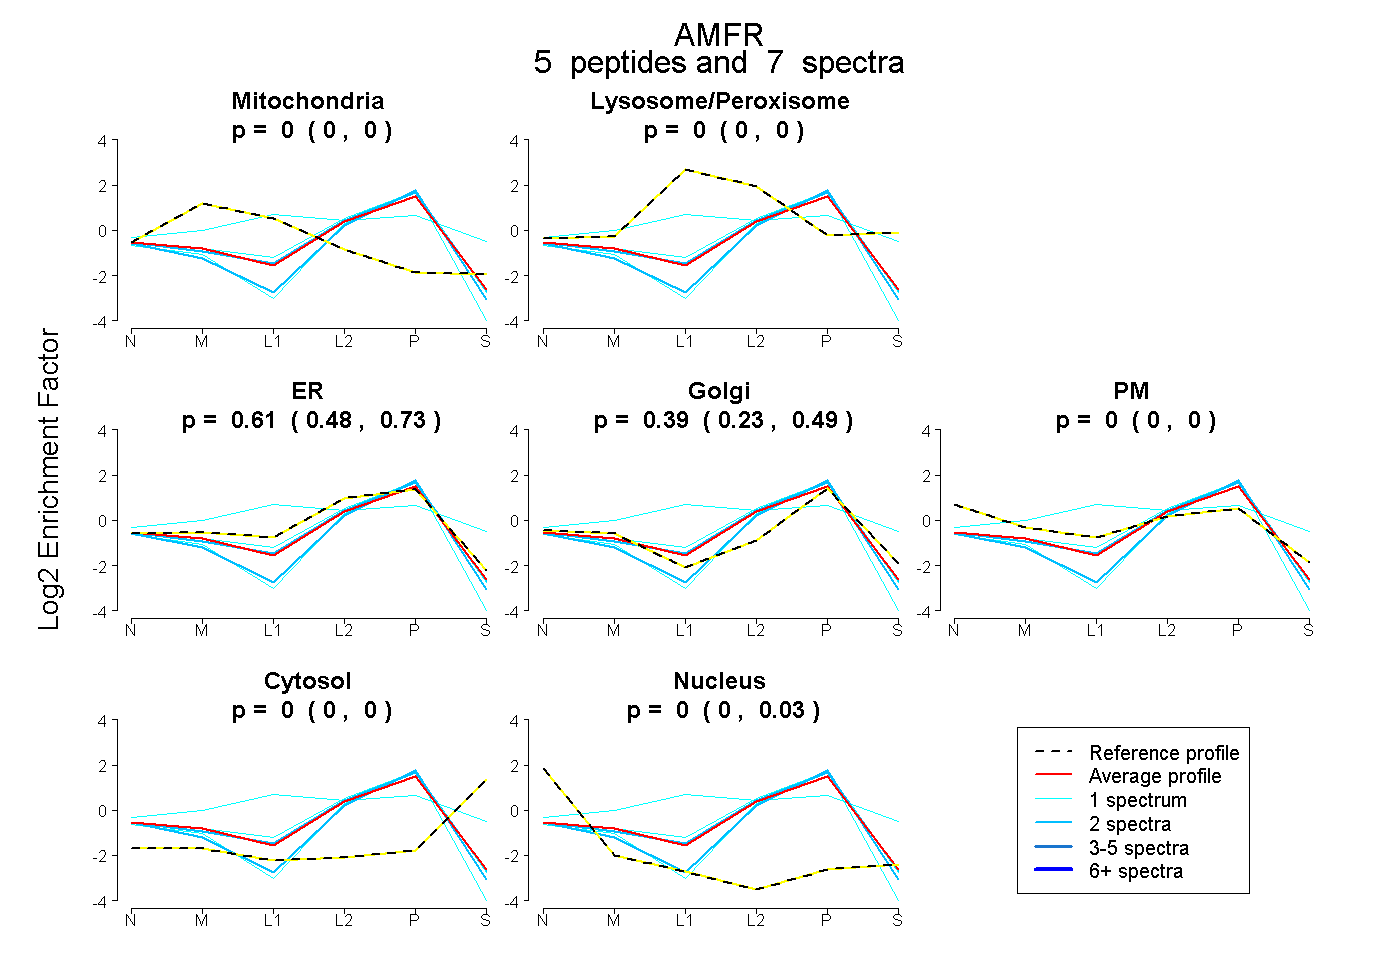 |
0.000 0.000 | 0.000 |
0.000 0.000 | 0.000 |
0.612 0.480 | 0.730 |
0.388 0.228 | 0.495 |
0.000 0.000 | 0.000 |
0.000 0.000 | 0.000 |
0.000 0.000 | 0.026 |
|||
| Plot | Lyso | Other | |||||||||||
| Expt C |
4 peptides |
7 spectra |
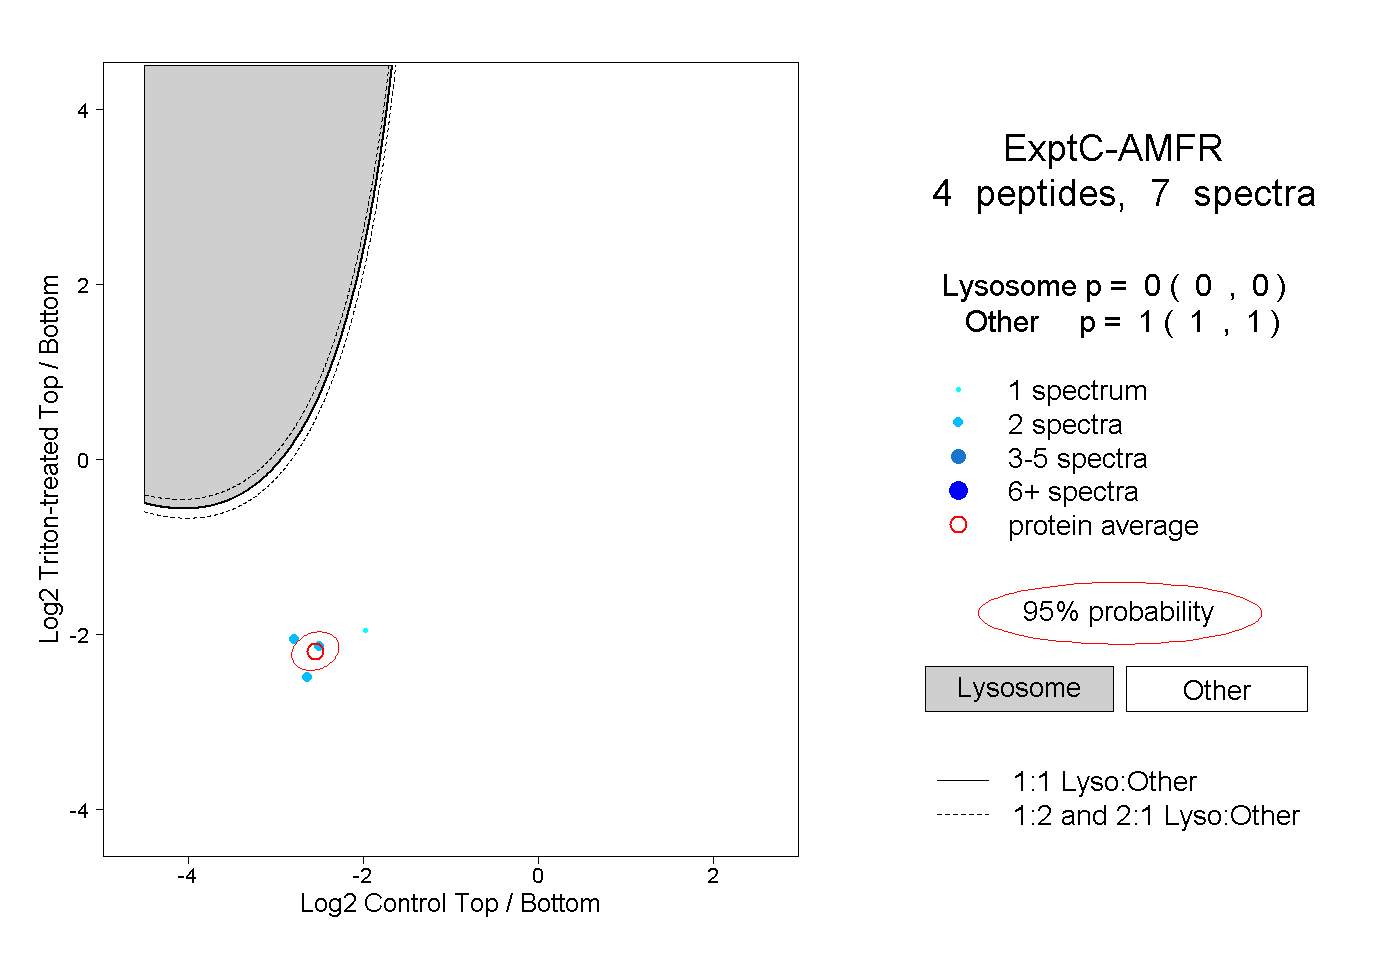 |
0.000 0.000 | 0.000 |
1.000 1.000 | 1.000 |
||||||||
| Plot | Lyso | Other | |||||||||||
| Expt D |
1 peptide |
2 spectra |
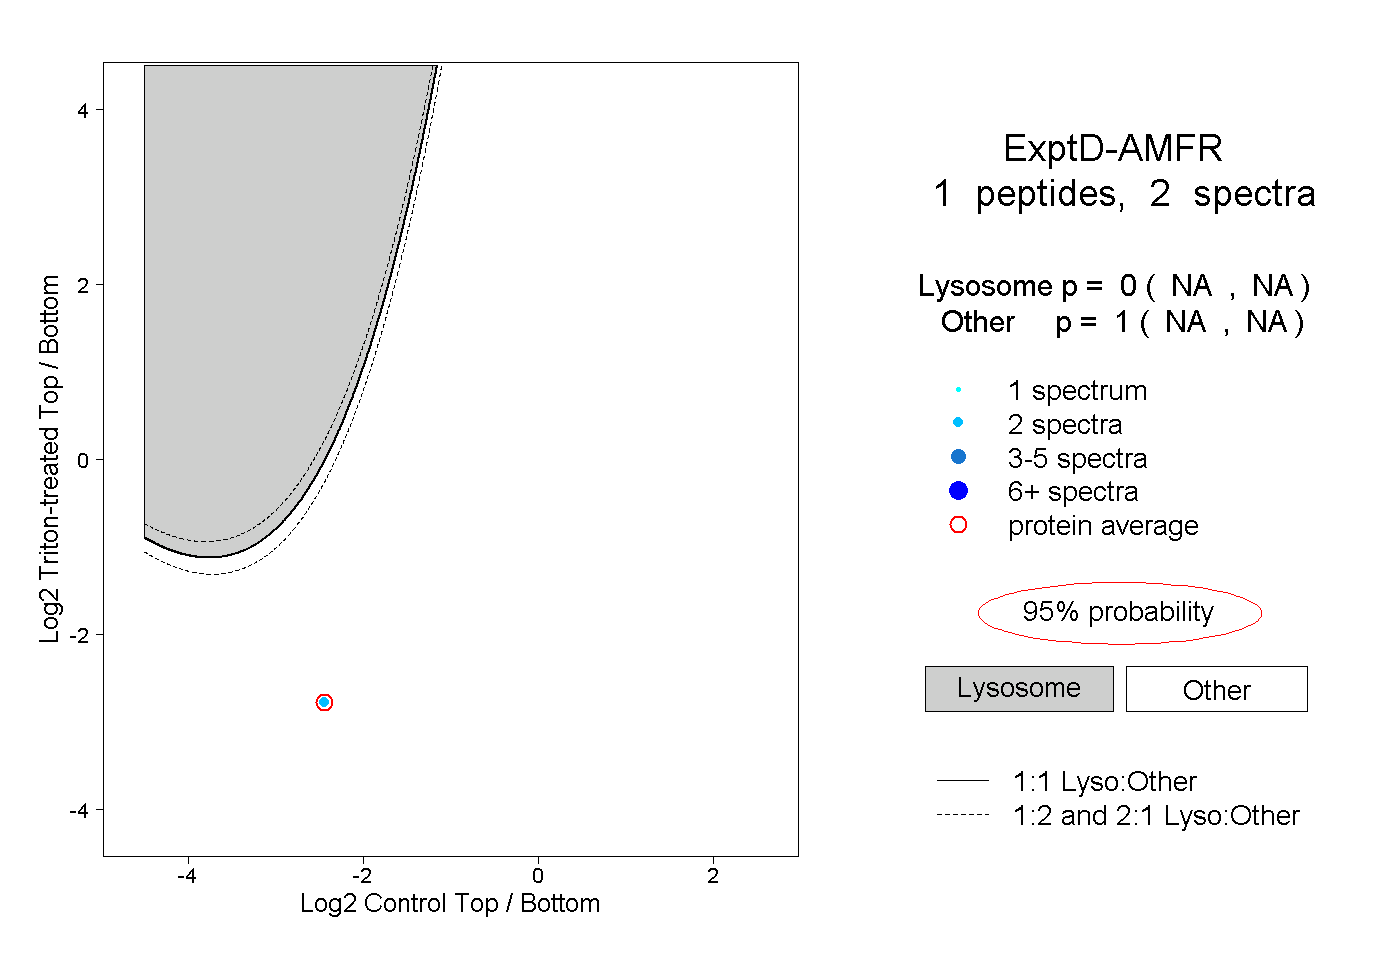 |
0.000 NA | NA |
1.000 NA | NA |