 2
2peptides
spectra
0.000 | 0.000
0.000 | 0.000
0.170 | 0.634
0.000 | 0.168
0.000 | 0.007
0.000 | 0.177
0.000 | 0.168
0.319 | 0.471
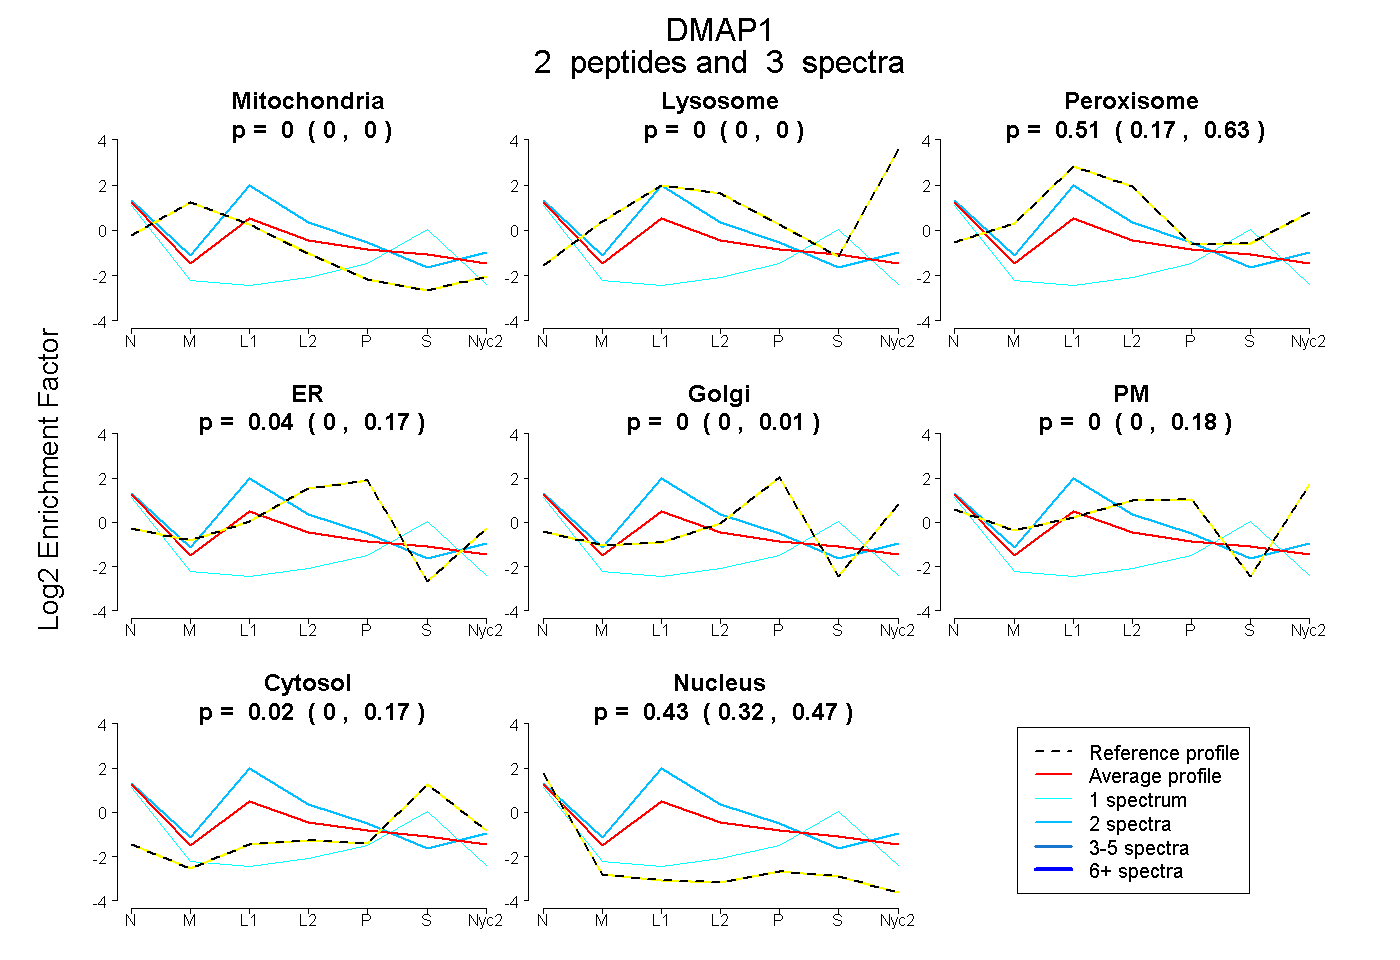
| Plot | Mito | Lyso | Perox | ER | Golgi | PM | Cytosol | Nucleus | |||||
| Expt A |
2 peptides |
3 spectra |
|
0.000 0.000 | 0.000 |
0.000 0.000 | 0.000 |
0.512 0.170 | 0.634 |
0.043 0.000 | 0.168 |
0.000 0.000 | 0.007 |
0.000 0.000 | 0.177 |
0.016 0.000 | 0.168 |
0.429 0.319 | 0.471 |