 4
4peptides
spectra
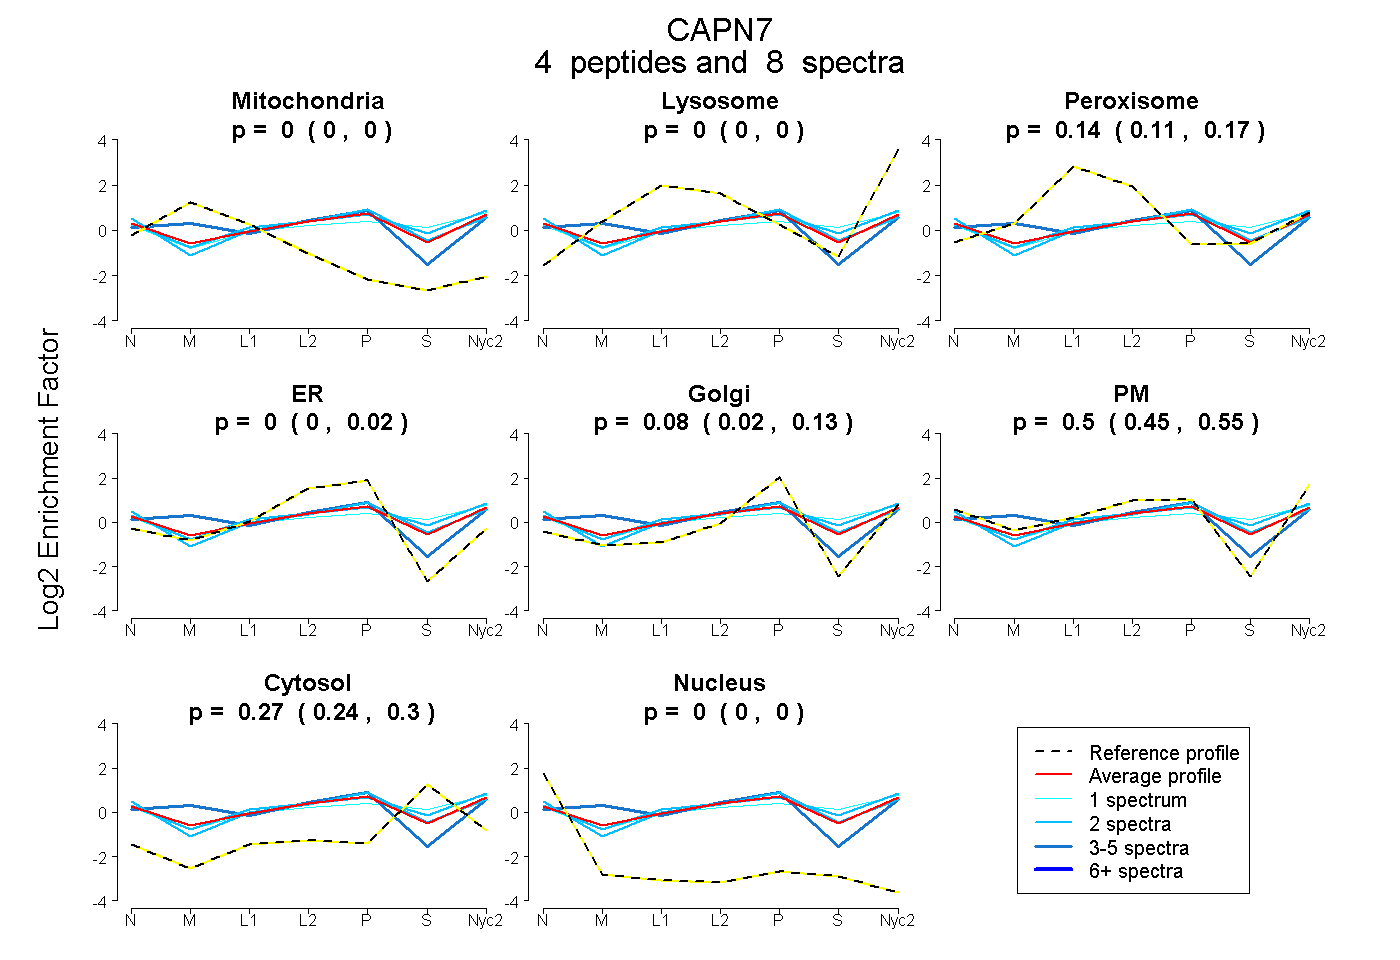
0.000 | 0.000
0.000 | 0.000
0.108 | 0.167
0.000 | 0.019
0.024 | 0.126
0.450 | 0.551
0.240 | 0.299
0.000 | 0.000
| Plot | Mito | Lyso | Perox | ER | Golgi | PM | Cytosol | Nucleus | |||||
| Expt A |
4 peptides |
8 spectra |
|
0.000 0.000 | 0.000 |
0.000 0.000 | 0.000 |
0.142 0.108 | 0.167 |
0.000 0.000 | 0.019 |
0.083 0.024 | 0.126 |
0.504 0.450 | 0.551 |
0.271 0.240 | 0.299 |
0.000 0.000 | 0.000 |
| 2 spectra, STDPLK | 0.000 | 0.000 | 0.157 | 0.000 | 0.000 | 0.532 | 0.311 | 0.000 | ||
| 2 spectra, YTAEEIEVLR | 0.000 | 0.000 | 0.057 | 0.091 | 0.000 | 0.541 | 0.311 | 0.000 | ||
| 3 spectra, NPWSHLR | 0.140 | 0.000 | 0.152 | 0.000 | 0.341 | 0.331 | 0.035 | 0.000 | ||
| 1 spectrum, LITSIIYPQNK | 0.000 | 0.000 | 0.156 | 0.000 | 0.000 | 0.466 | 0.378 | 0.000 |
| Plot | Lyso | Other | |||||||||||
| Expt C |
6 peptides |
7 spectra |
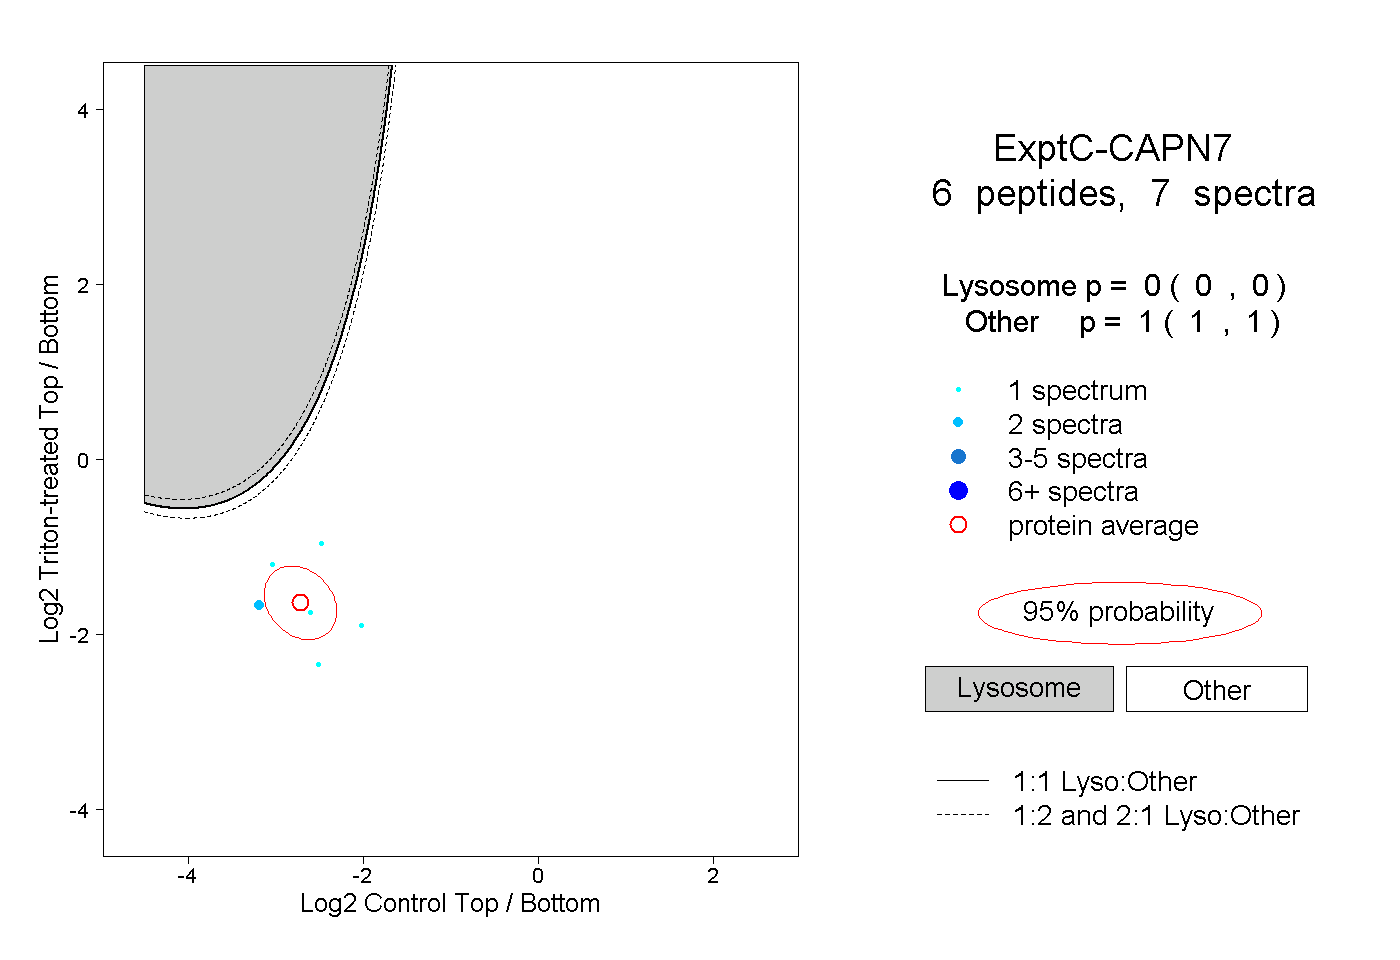 |
0.000 0.000 | 0.000 |
1.000 1.000 | 1.000 |