 3
3peptides
spectra
0.000 | 0.000
0.000 | 0.000
0.000 | 0.025
0.000 | 0.077
0.000 | 0.303
0.000 | 0.272
0.436 | 0.619
0.128 | 0.289
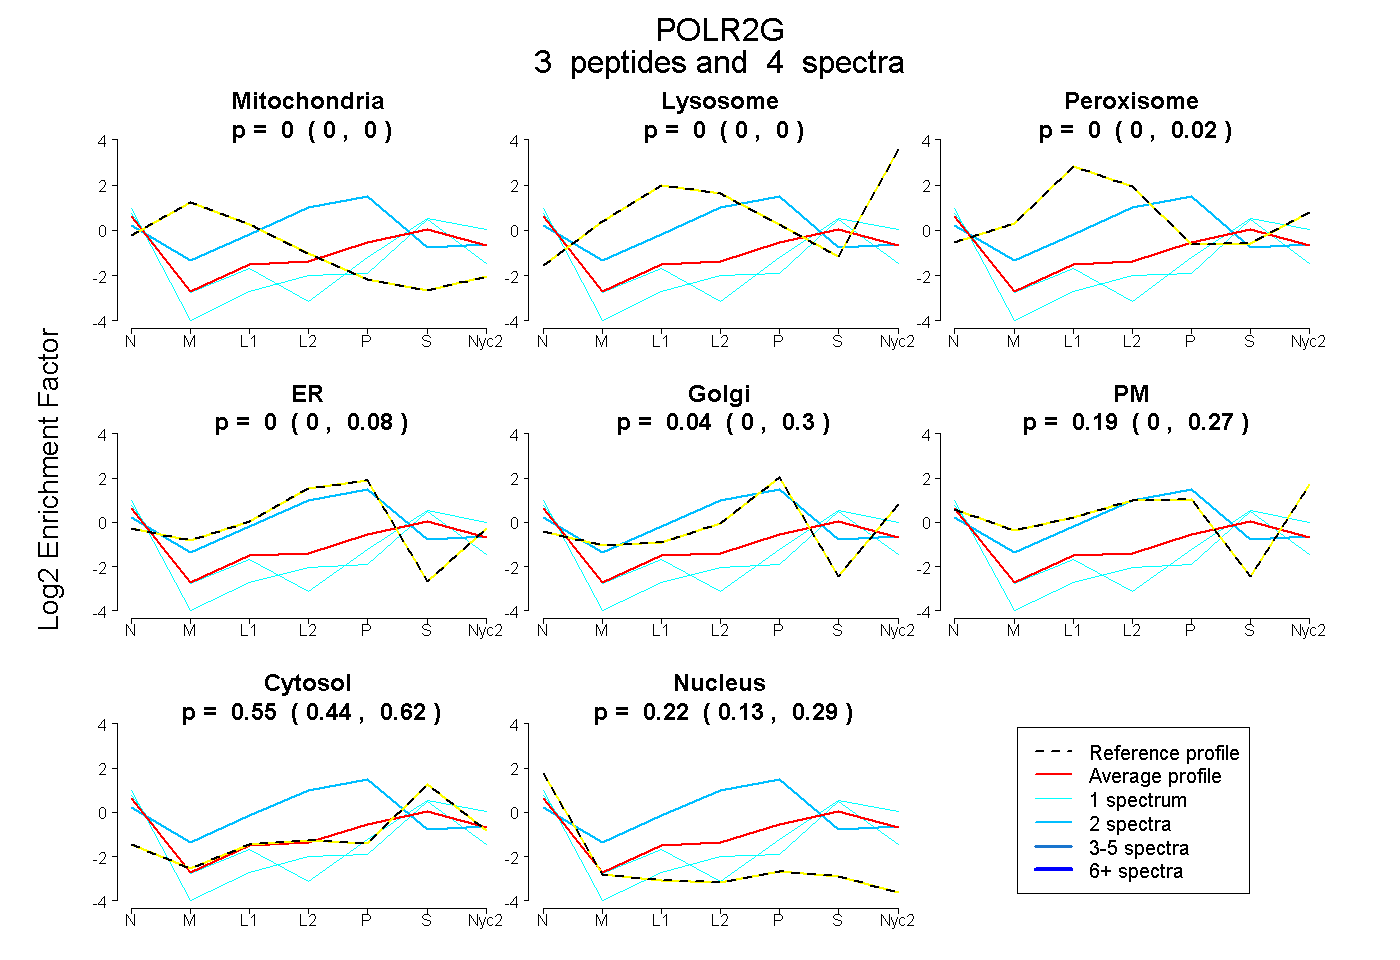
| Plot | Mito | Lyso | Perox | ER | Golgi | PM | Cytosol | Nucleus | |||||
| Expt A |
3 peptides |
4 spectra |
|
0.000 0.000 | 0.000 |
0.000 0.000 | 0.000 |
0.000 0.000 | 0.025 |
0.000 0.000 | 0.077 |
0.041 0.000 | 0.303 |
0.188 0.000 | 0.272 |
0.554 0.436 | 0.619 |
0.218 0.128 | 0.289 |
| 2 spectra, YFGPNLLNTVK | 0.000 | 0.000 | 0.033 | 0.701 | 0.000 | 0.000 | 0.267 | 0.000 | ||
| 1 spectrum, GFVLYPVK | 0.000 | 0.000 | 0.000 | 0.000 | 0.000 | 0.084 | 0.662 | 0.255 | ||
| 1 spectrum, AIVFRPFK | 0.000 | 0.000 | 0.000 | 0.000 | 0.000 | 0.000 | 0.603 | 0.397 |