 4
4peptides
spectra
0.000 | 0.000
0.000 | 0.000
0.000 | 0.021
0.000 | 0.138
0.000 | 0.000
0.491 | 0.685
0.287 | 0.363
0.000 | 0.000
1peptide
spectrum
NA | NA
NA | NA
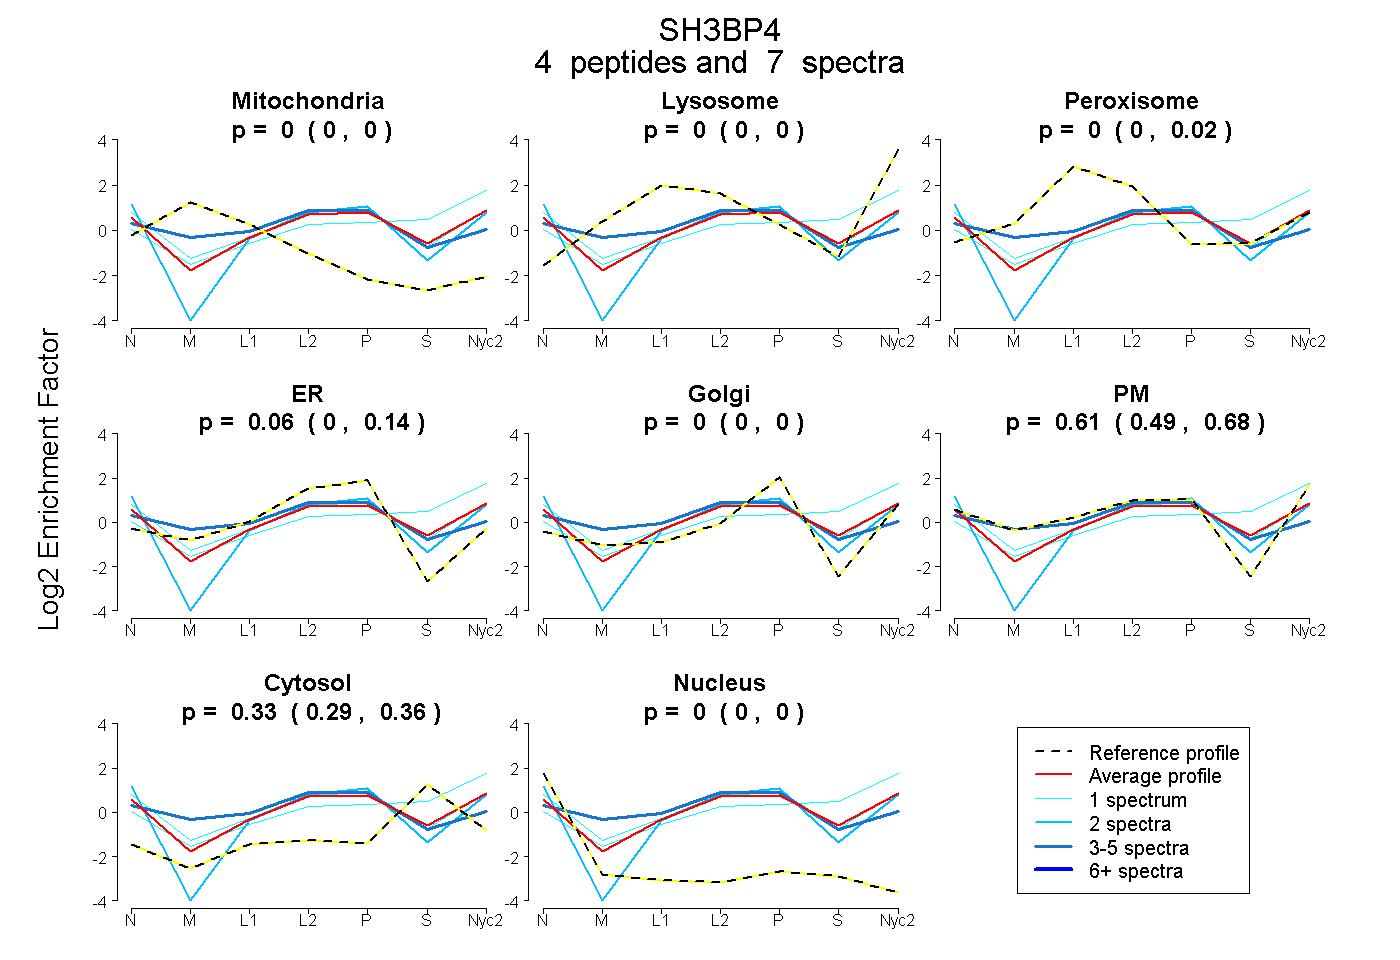
| Plot | Mito | Lyso | Perox | ER | Golgi | PM | Cytosol | Nucleus | |||||
| Expt A |
4 peptides |
7 spectra |
|
0.000 0.000 | 0.000 |
0.000 0.000 | 0.000 |
0.000 0.000 | 0.021 |
0.056 0.000 | 0.138 |
0.000 0.000 | 0.000 |
0.614 0.491 | 0.685 |
0.330 0.287 | 0.363 |
0.000 0.000 | 0.000 |
||
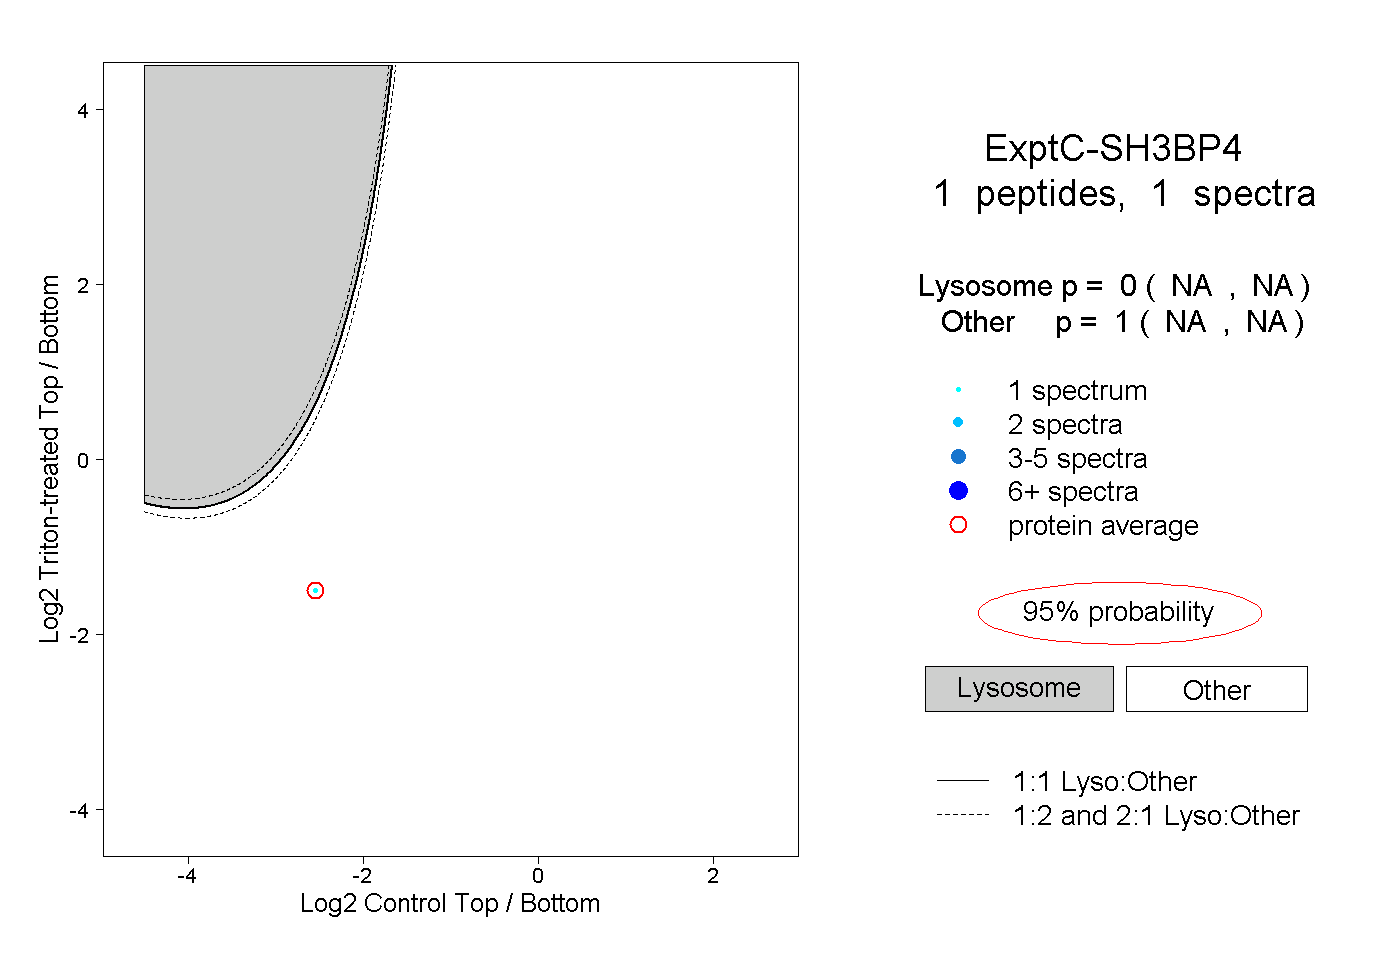
| Plot | Lyso | Other | |||||||||||
| Expt C |
1 peptide |
1 spectrum |
|
0.000 NA | NA |
1.000 NA | NA |