 4
4peptides
spectra
0.000 | 0.038
0.000 | 0.000
0.000 | 0.000
0.000 | 0.000
0.000 | 0.000
0.000 | 0.000
0.770 | 0.850
0.127 | 0.220
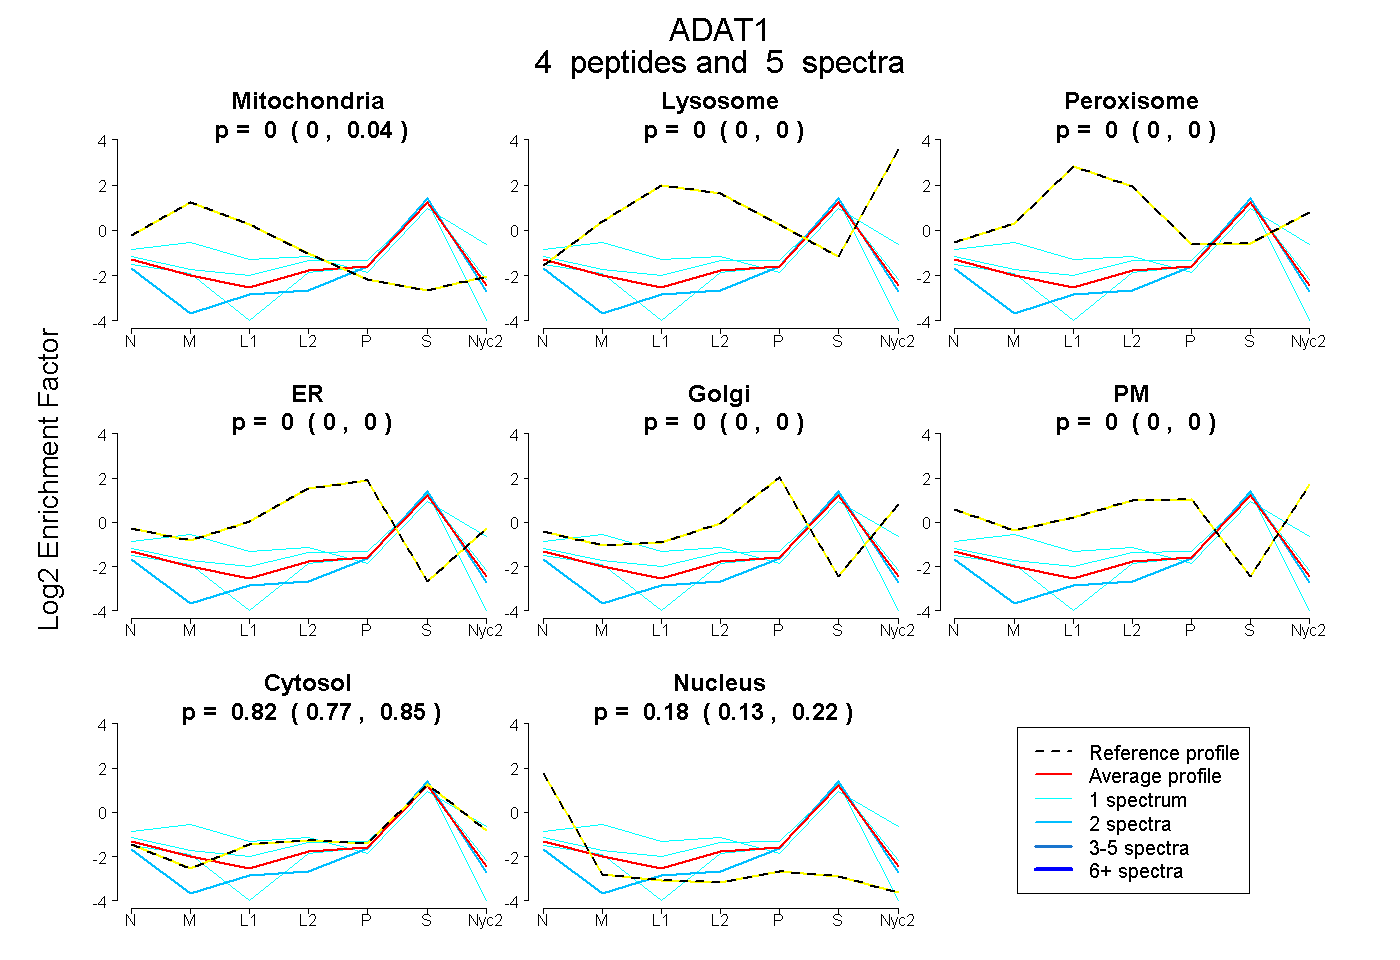
| Plot | Mito | Lyso | Perox | ER | Golgi | PM | Cytosol | Nucleus | |||||
| Expt A |
4 peptides |
5 spectra |
|
0.000 0.000 | 0.038 |
0.000 0.000 | 0.000 |
0.000 0.000 | 0.000 |
0.000 0.000 | 0.000 |
0.000 0.000 | 0.000 |
0.000 0.000 | 0.000 |
0.816 0.770 | 0.850 |
0.184 0.127 | 0.220 |
| 2 spectra, VQPFSSWIR | 0.000 | 0.000 | 0.000 | 0.000 | 0.000 | 0.000 | 0.783 | 0.217 | ||
| 1 spectrum, KPGAAYHQVGLLR | 0.000 | 0.000 | 0.000 | 0.000 | 0.000 | 0.000 | 0.676 | 0.324 | ||
| 1 spectrum, GFEVQELK | 0.062 | 0.000 | 0.000 | 0.000 | 0.000 | 0.000 | 0.836 | 0.102 | ||
| 1 spectrum, EWTLLAAVVK | 0.249 | 0.042 | 0.000 | 0.000 | 0.000 | 0.000 | 0.709 | 0.000 |