13
13peptides
spectra
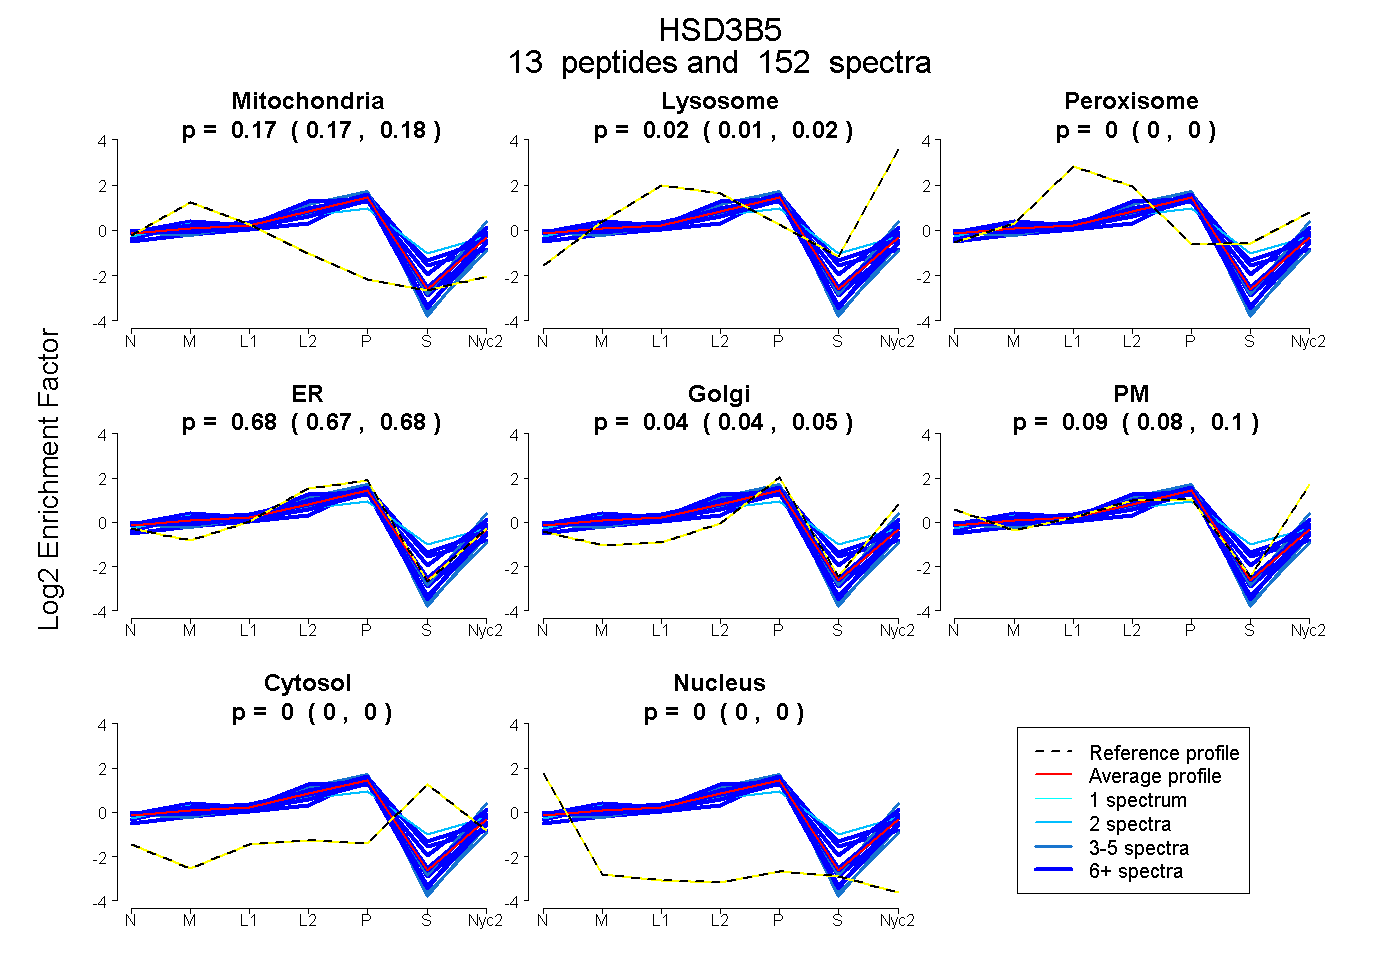
0.172 | 0.176
0.011 | 0.020
0.000 | 0.000
0.669 | 0.681
0.036 | 0.047
0.084 | 0.099
0.000 | 0.000
0.000 | 0.000
11peptides
spectra
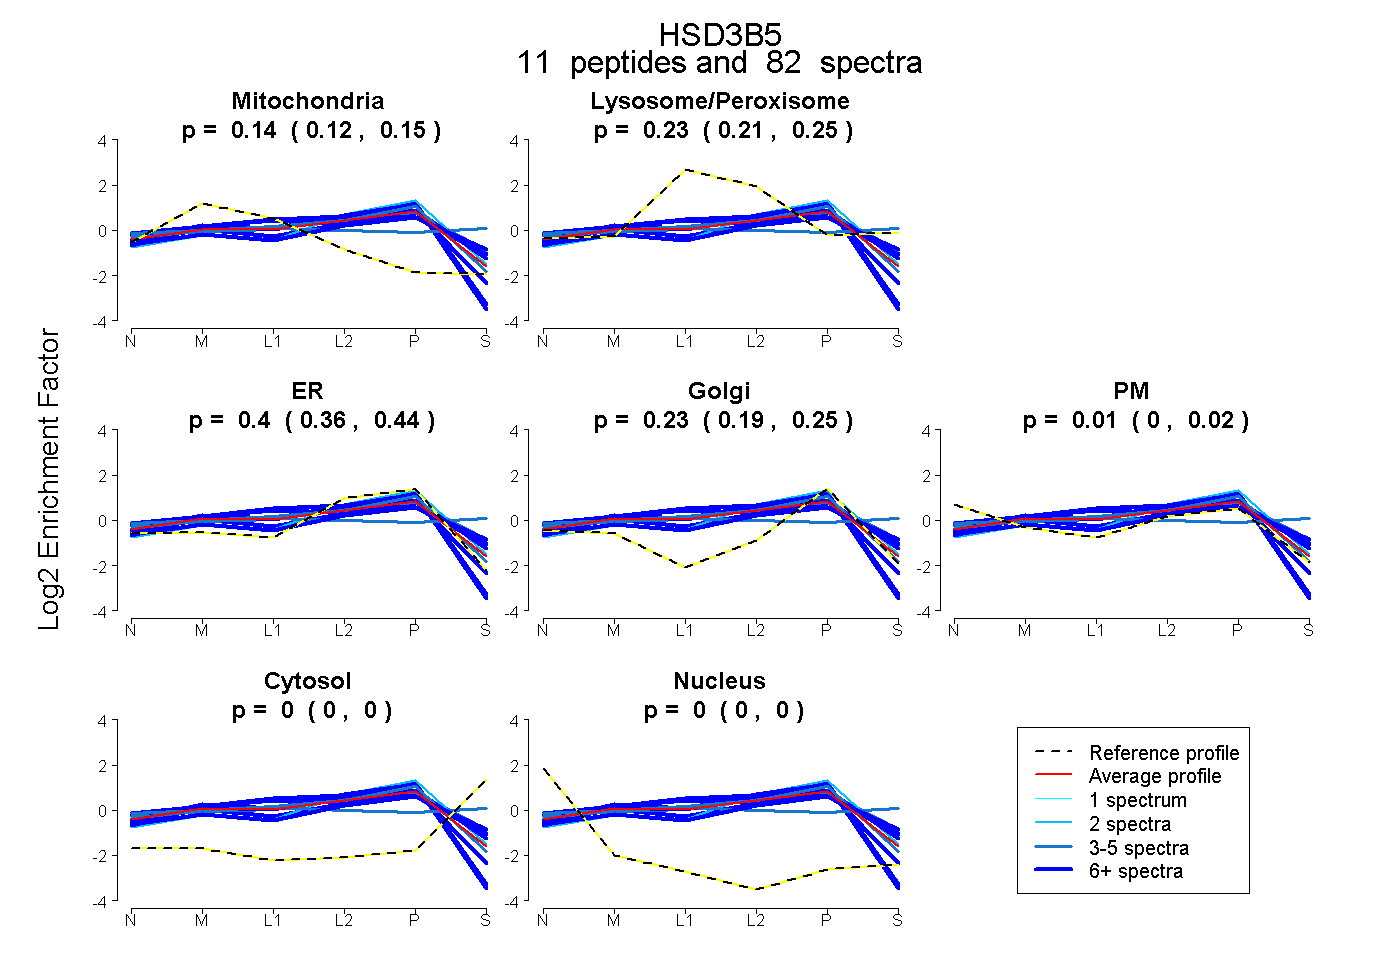
0.122 | 0.148
0.205 | 0.250
0.358 | 0.439
0.186 | 0.254
0.000 | 0.018
0.000 | 0.000
0.000 | 0.000