8
8peptides
spectra
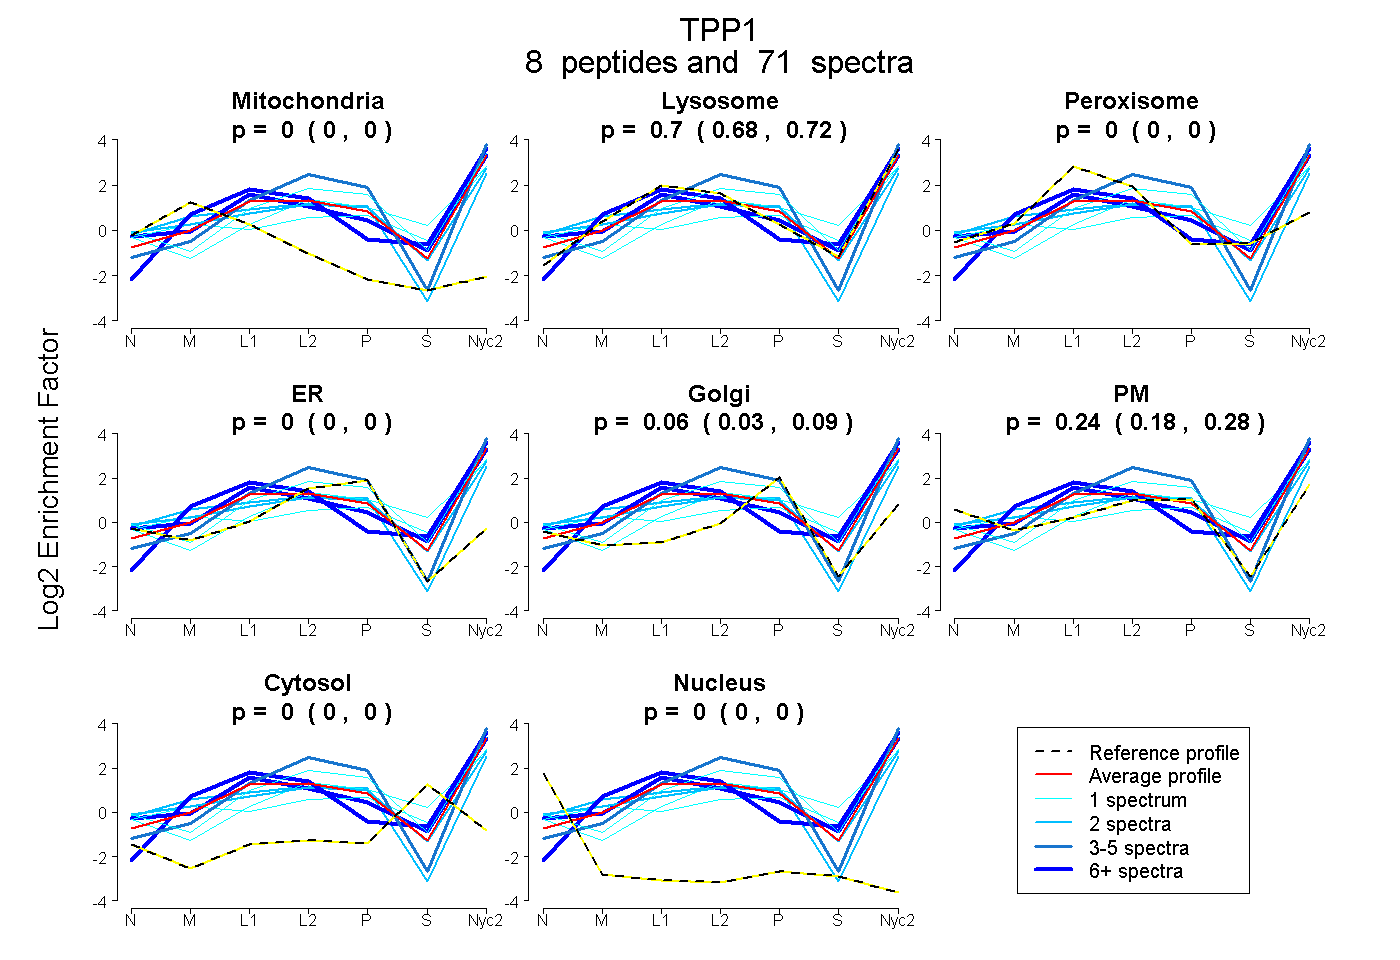
0.000 | 0.000
0.681 | 0.722
0.000 | 0.000
0.000 | 0.000
0.028 | 0.089
0.185 | 0.276
0.000 | 0.000
0.000 | 0.000
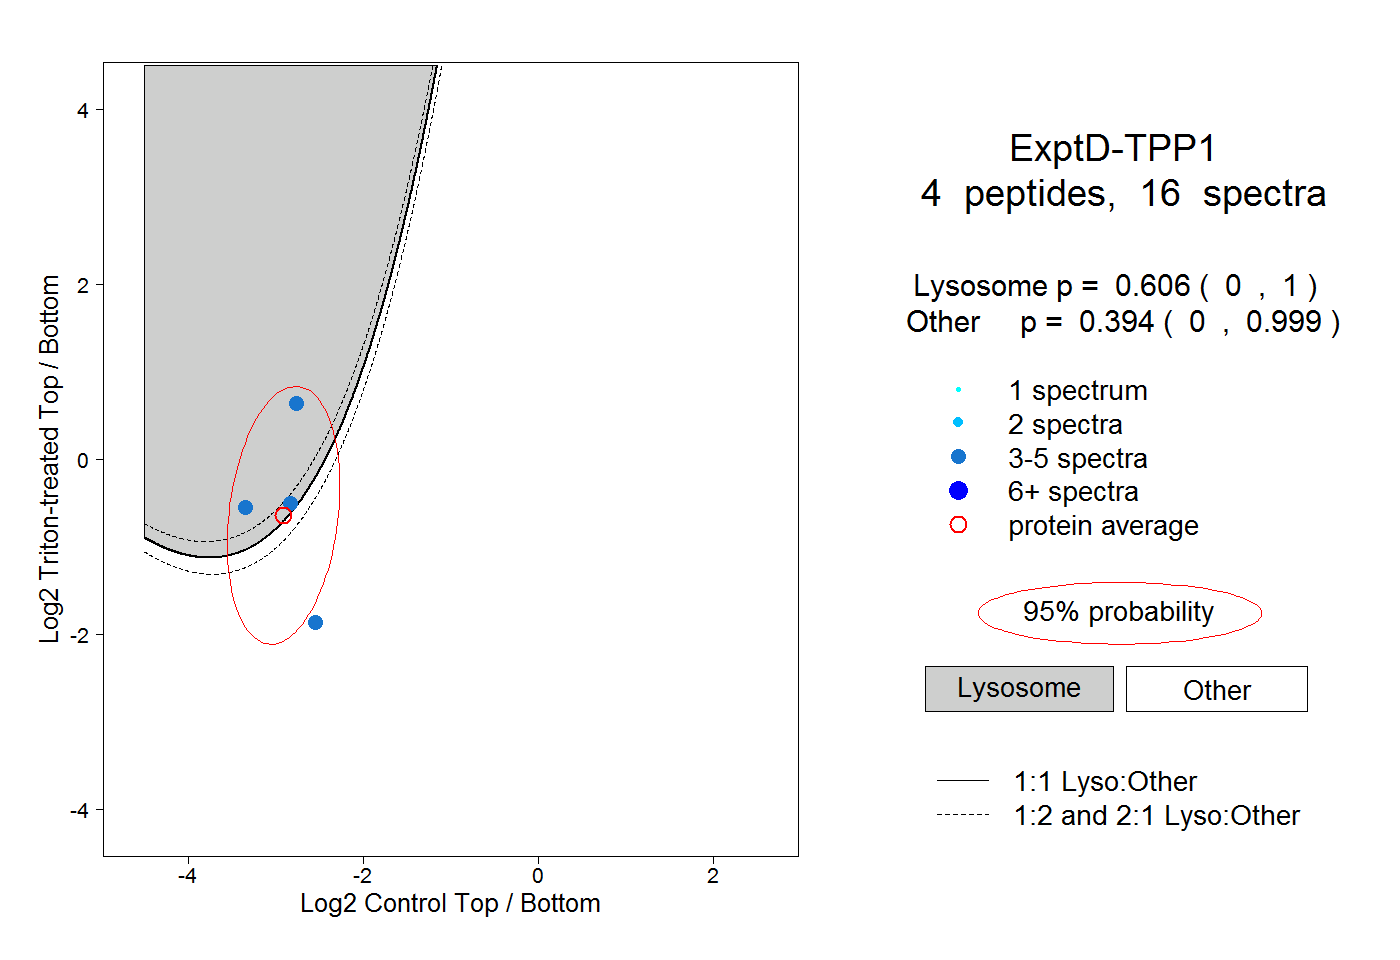
4peptides
spectra
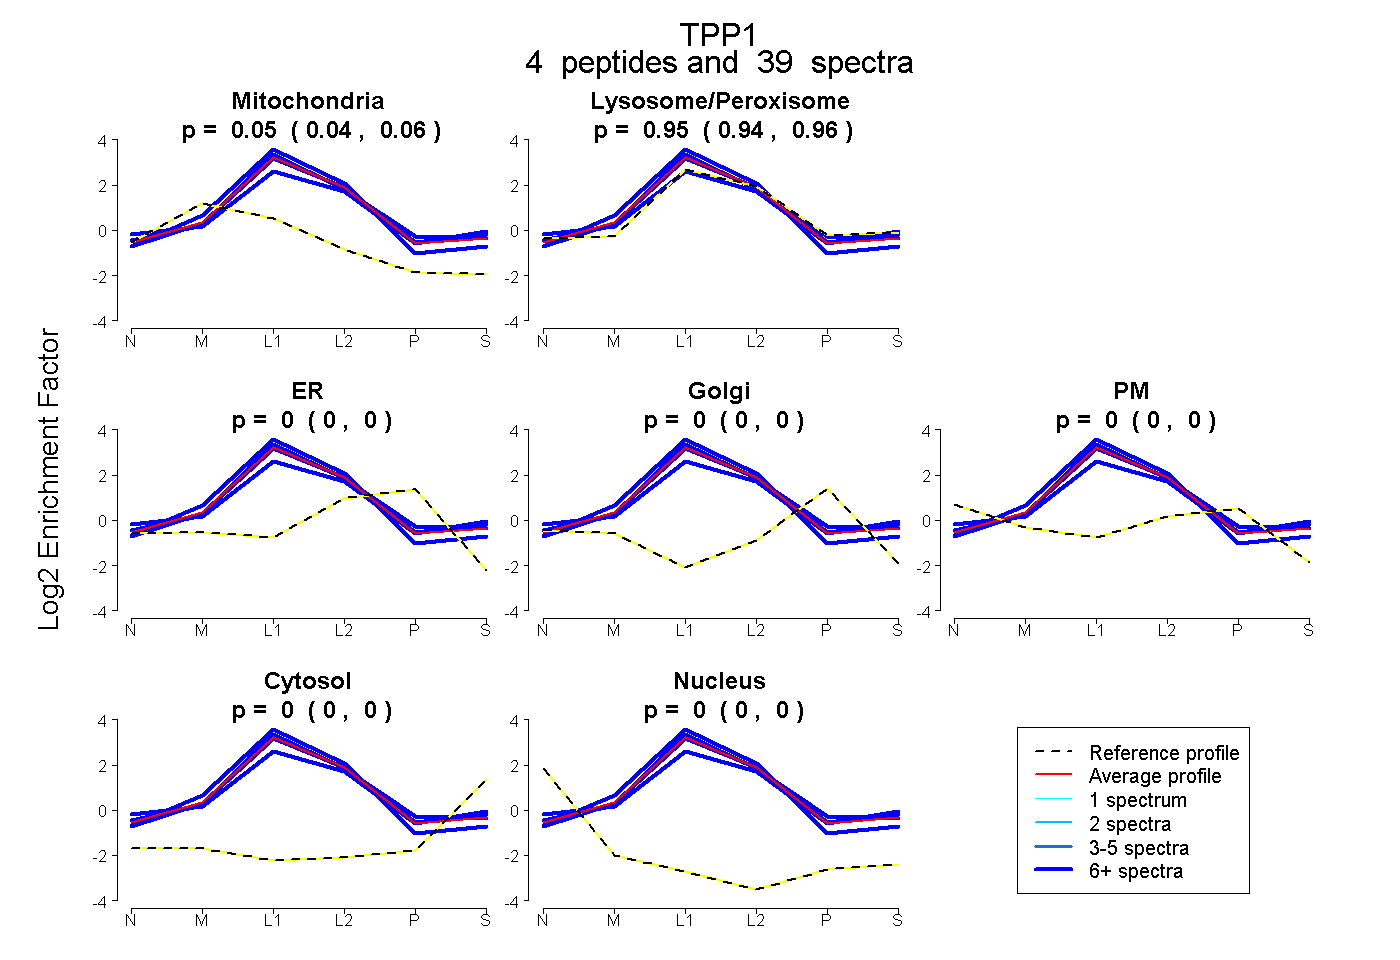
0.039 | 0.059
0.940 | 0.959
0.000 | 0.000
0.000 | 0.000
0.000 | 0.000
0.000 | 0.000
0.000 | 0.000
7peptides
spectra
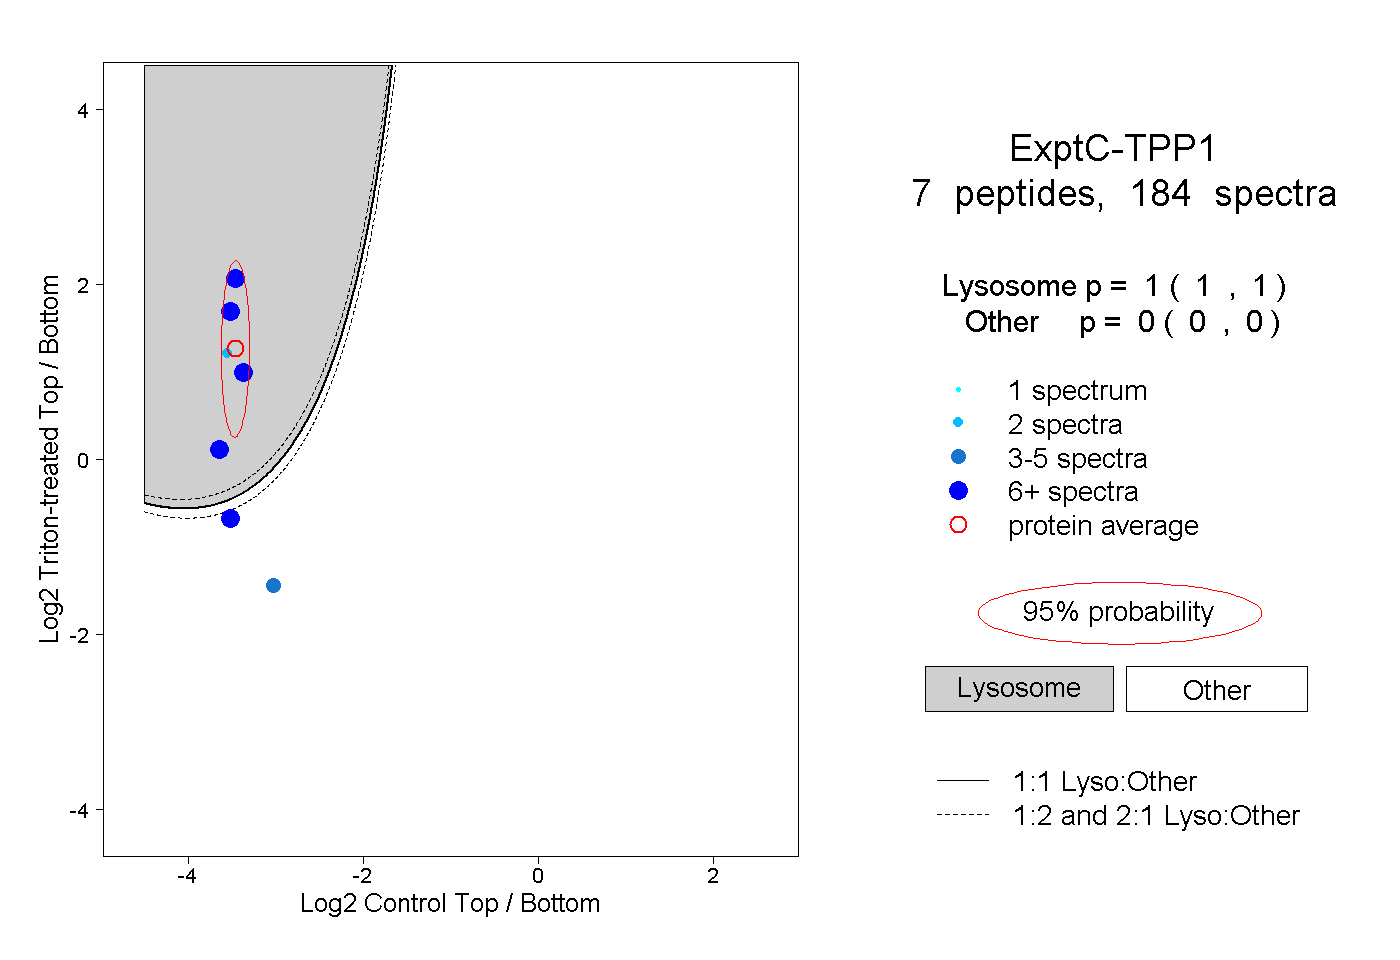
1.000 | 1.000
0.000 | 0.000