 8
8peptides
spectra
0.000 | 0.000
0.681 | 0.722
0.000 | 0.000
0.000 | 0.000
0.028 | 0.089
0.185 | 0.276
0.000 | 0.000
0.000 | 0.000
| Plot | Mito | Lyso | Perox | ER | Golgi | PM | Cytosol | Nucleus | |||||
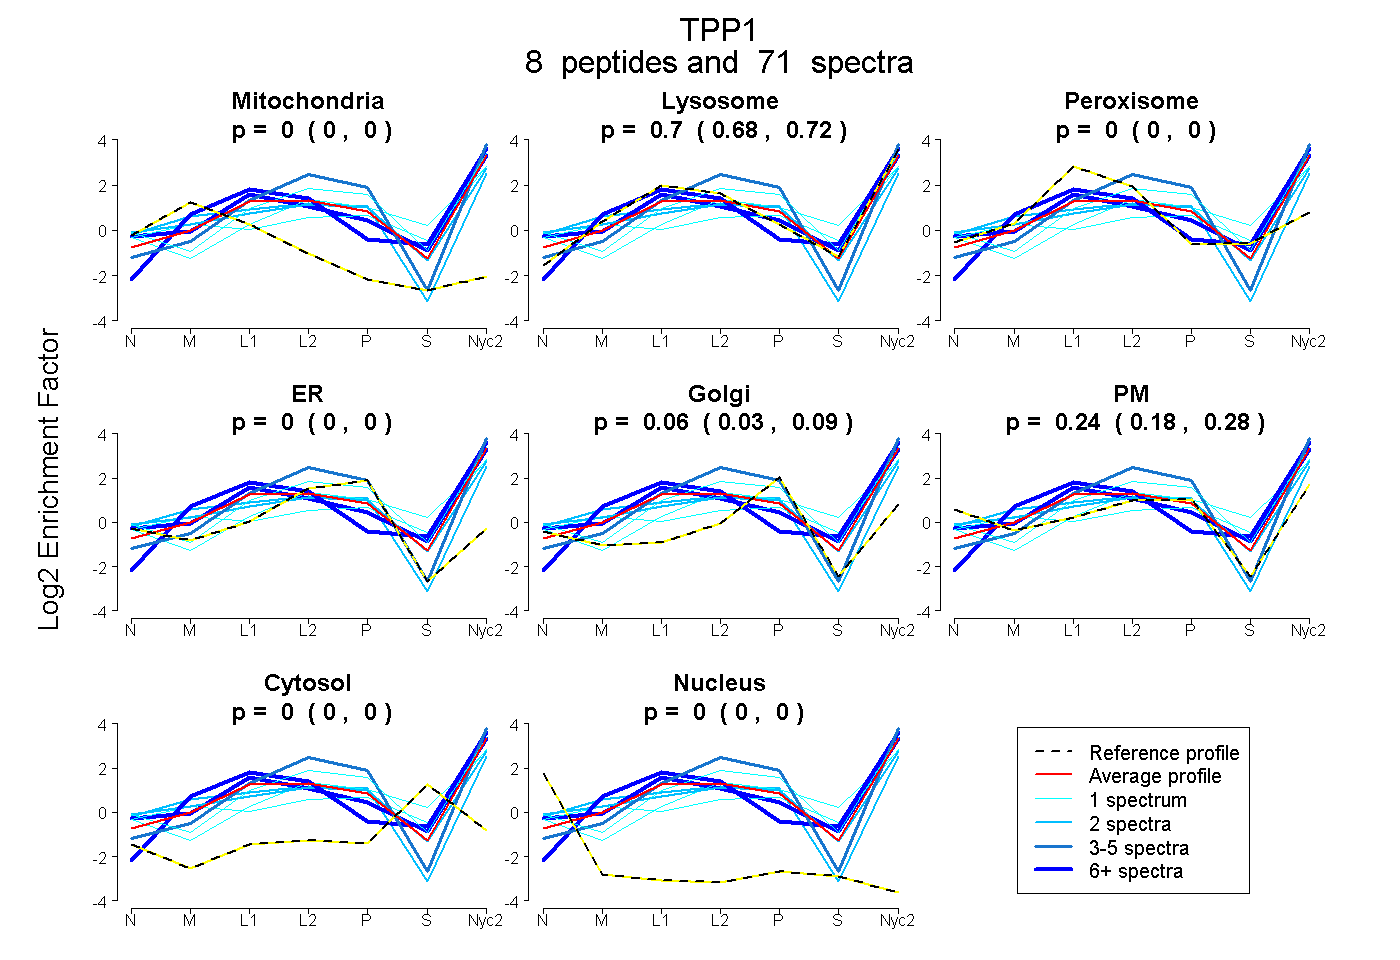
| Expt A |
8 peptides |
71 spectra |
|
0.000 0.000 | 0.000 |
0.703 0.681 | 0.722 |
0.000 0.000 | 0.000 |
0.000 0.000 | 0.000 |
0.061 0.028 | 0.089 |
0.236 0.185 | 0.276 |
0.000 0.000 | 0.000 |
0.000 0.000 | 0.000 |
| 39 spectra, LFGSSFAHQASVAR | 0.000 | 0.698 | 0.000 | 0.000 | 0.000 | 0.264 | 0.038 | 0.000 | ||
| 2 spectra, FPPLSSPR | 0.000 | 0.304 | 0.000 | 0.000 | 0.000 | 0.696 | 0.000 | 0.000 | ||
| 22 spectra, VNTEFMK | 0.000 | 0.957 | 0.000 | 0.000 | 0.000 | 0.000 | 0.043 | 0.000 | ||
| 1 spectrum, WMLPPGWVSLGR | 0.000 | 0.545 | 0.000 | 0.000 | 0.039 | 0.416 | 0.000 | 0.000 | ||
| 1 spectrum, LSELVQAVSDPSSPR | 0.000 | 0.496 | 0.000 | 0.000 | 0.011 | 0.262 | 0.232 | 0.000 | ||
| 2 spectra, QQNLDR | 0.000 | 0.444 | 0.000 | 0.000 | 0.008 | 0.541 | 0.006 | 0.000 | ||
| 1 spectrum, QAELLLPGAEFHR | 0.000 | 0.477 | 0.000 | 0.000 | 0.028 | 0.336 | 0.160 | 0.000 | ||
| 3 spectra, WLLAAGAR | 0.000 | 0.695 | 0.000 | 0.169 | 0.000 | 0.137 | 0.000 | 0.000 |
| Plot | Mito | Lyso or Perox | ER | Golgi | PM | Cytosol | Nucleus | ||||||
| Expt B |
4 peptides |
39 spectra |
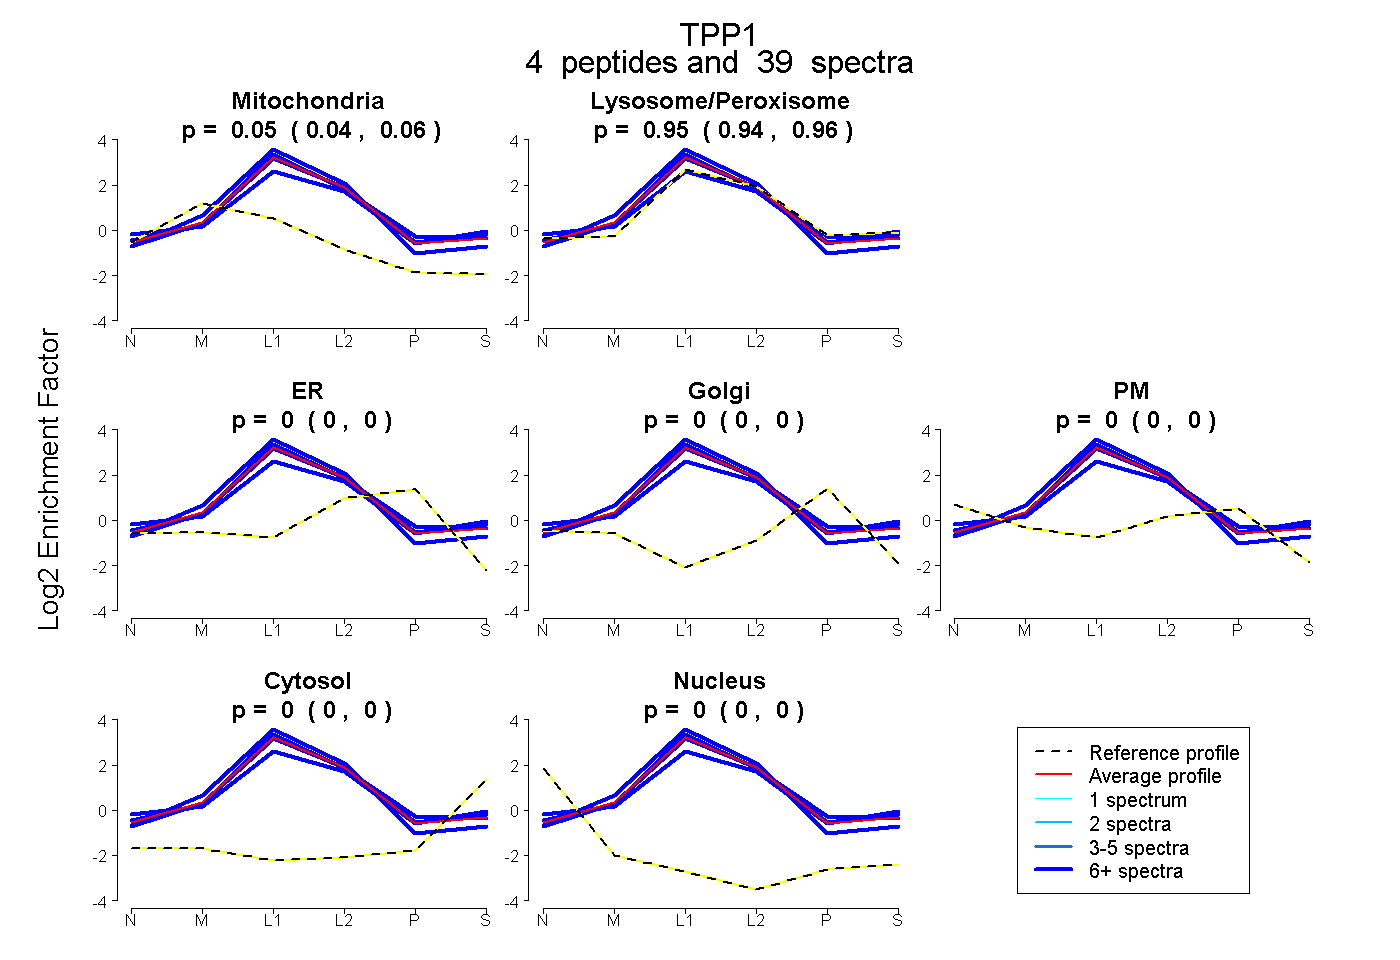 |
0.050 0.039 | 0.059 |
0.950 0.940 | 0.959 |
0.000 0.000 | 0.000 |
0.000 0.000 | 0.000 |
0.000 0.000 | 0.000 |
0.000 0.000 | 0.000 |
0.000 0.000 | 0.000 |
|||
| Plot | Lyso | Other | |||||||||||
| Expt C |
7 peptides |
184 spectra |
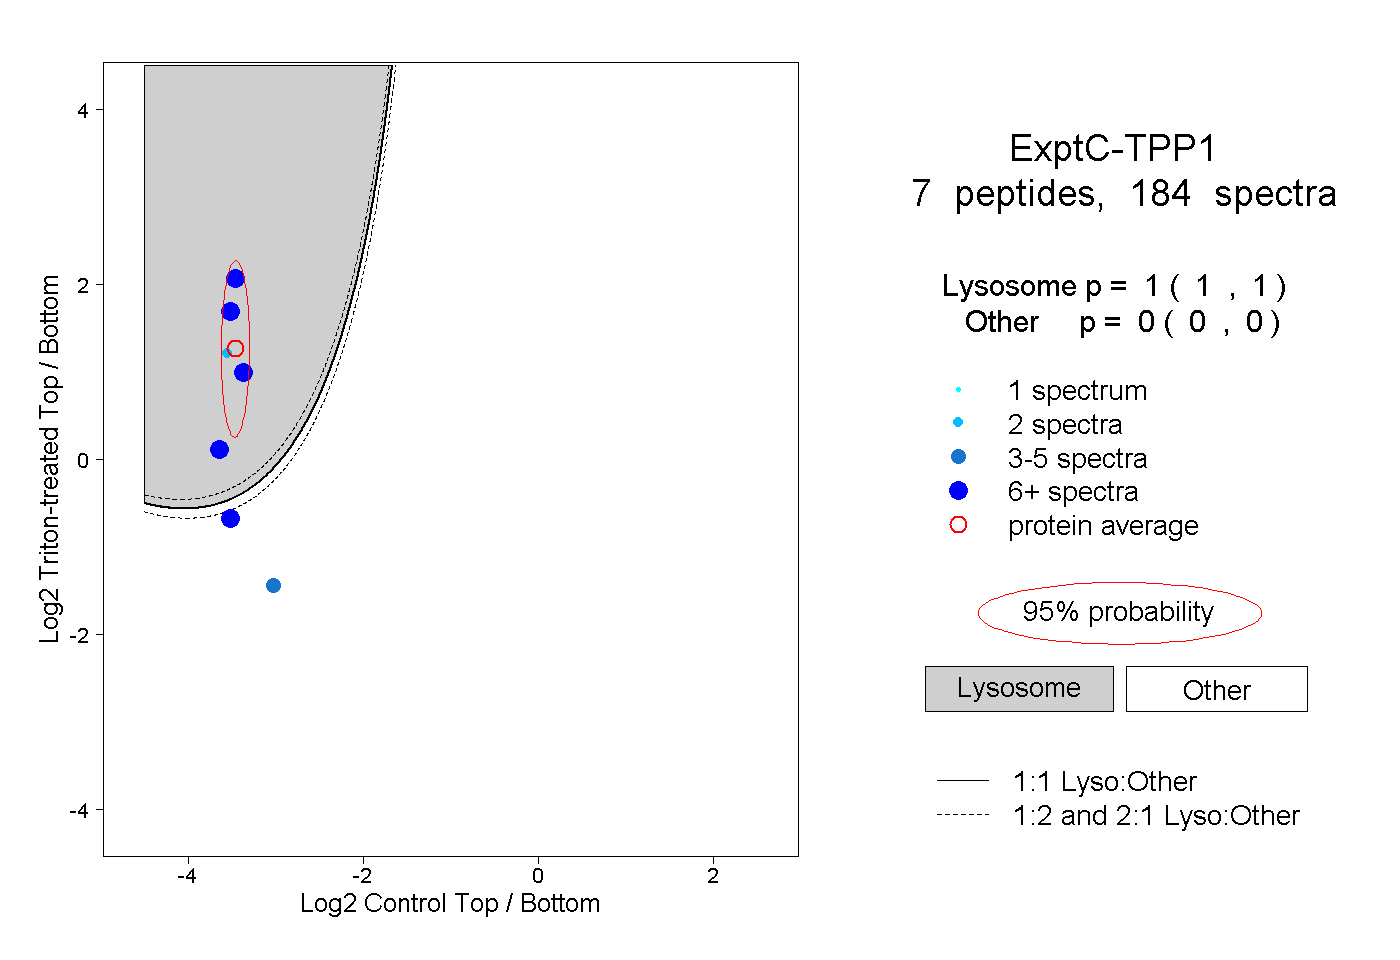 |
1.000 1.000 | 1.000 |
0.000 0.000 | 0.000 |
||||||||
| Plot | Lyso | Other | |||||||||||
| Expt D |
4 peptides |
16 spectra |
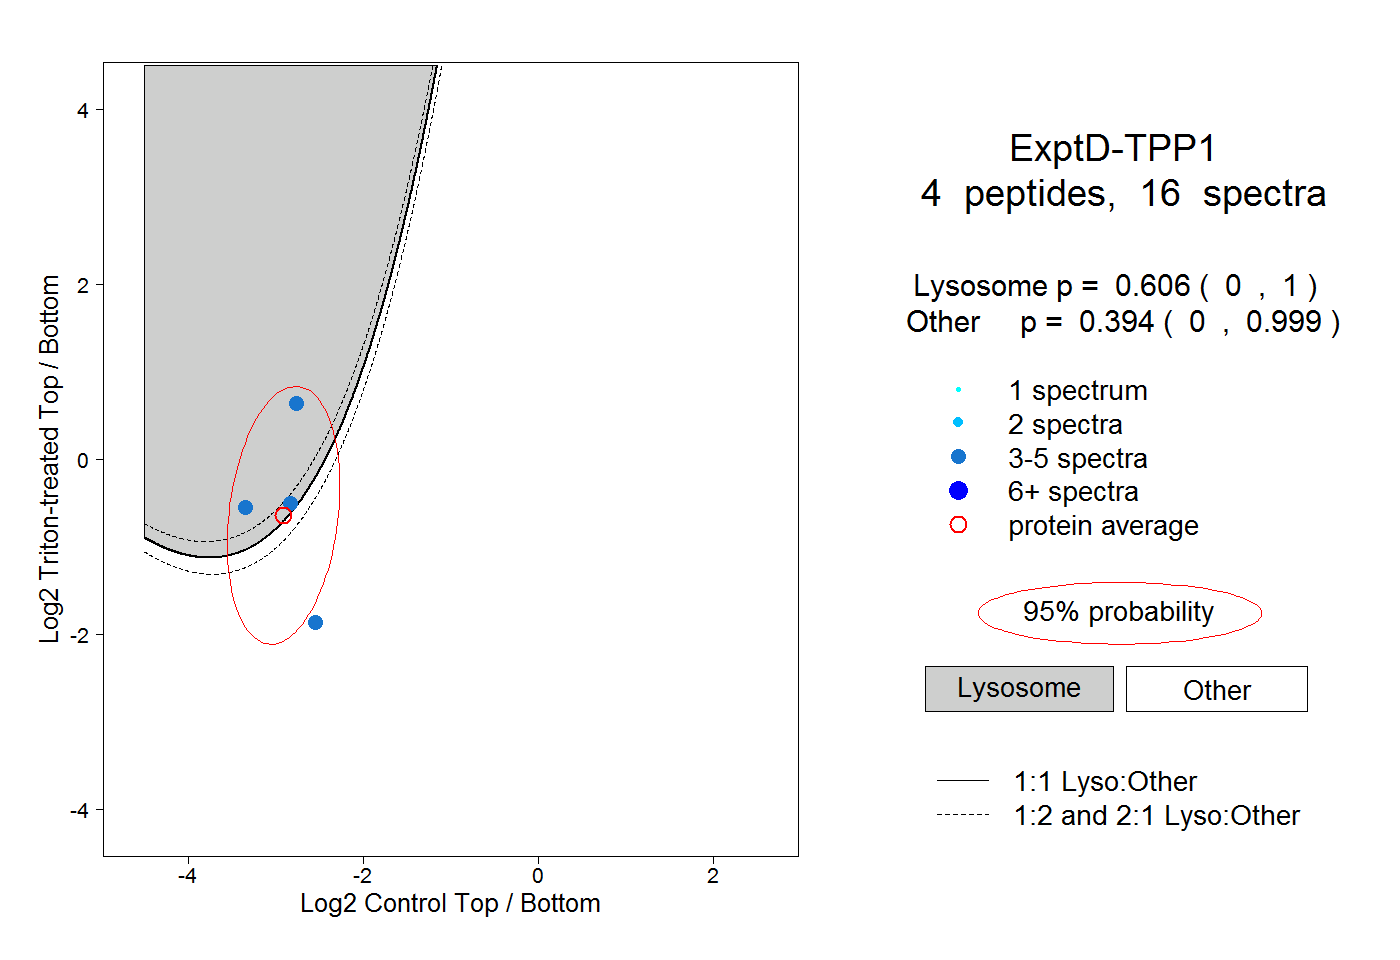 |
0.606 0.000 | 1.000 |
0.394 0.000 | 0.999 |