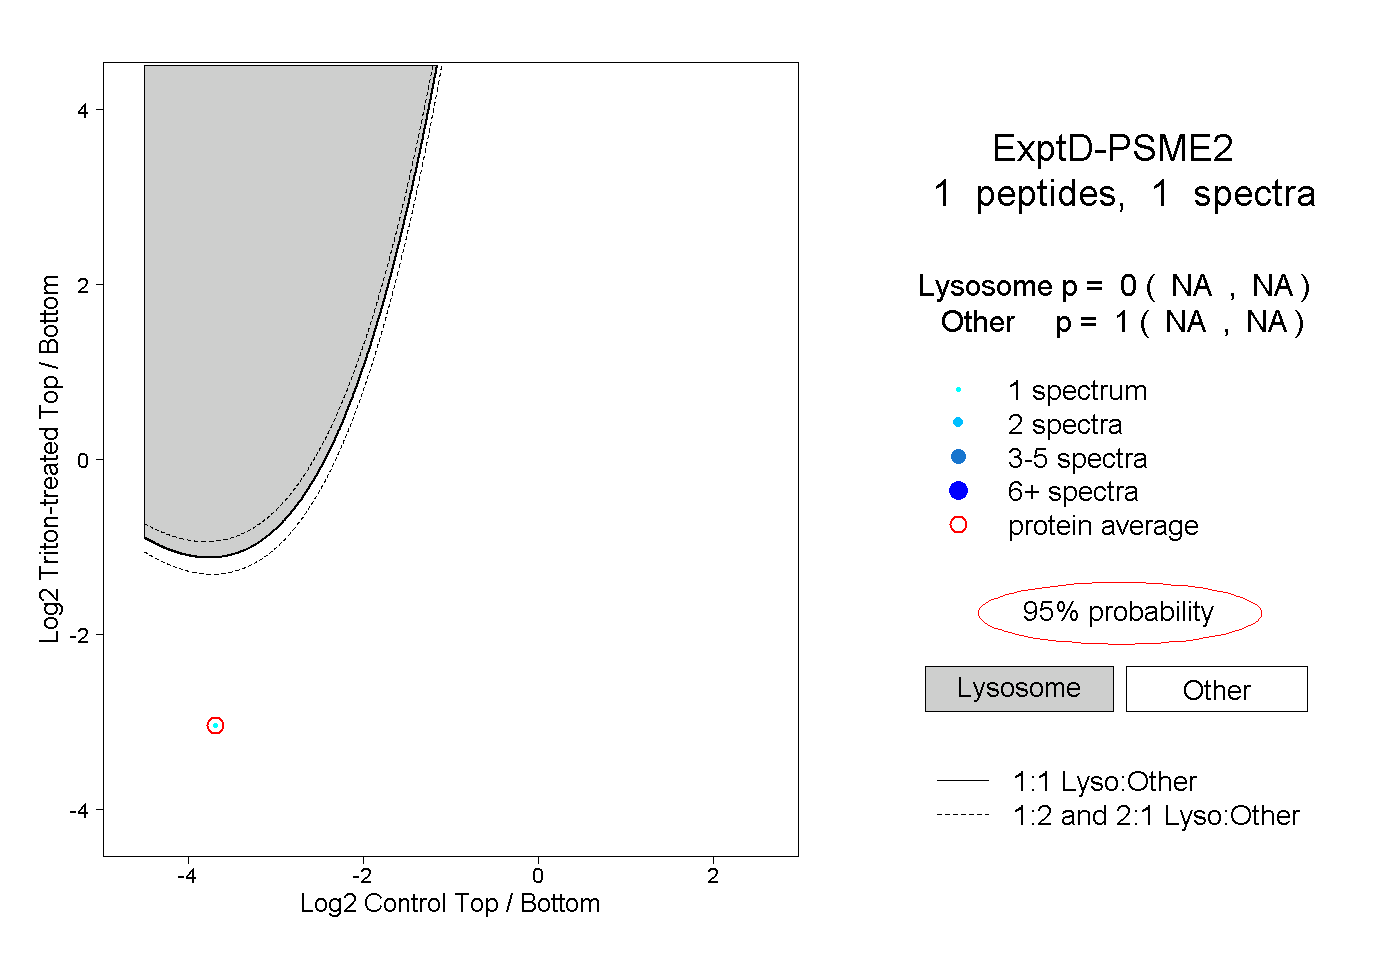
6
6peptides
spectra
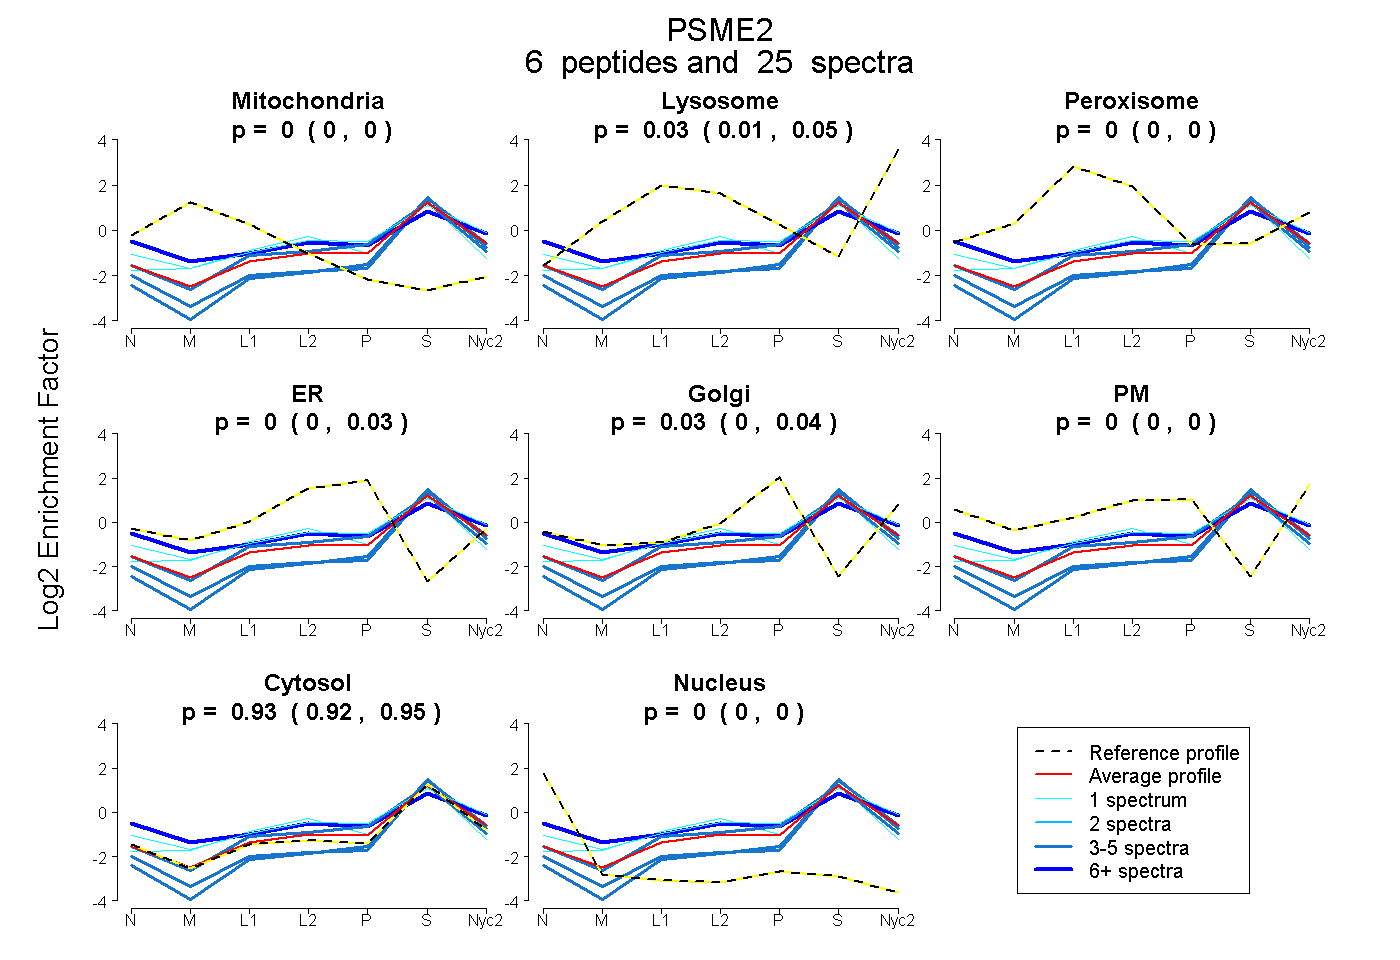
0.000 | 0.000
0.015 | 0.048
0.000 | 0.000
0.000 | 0.029
0.000 | 0.045
0.000 | 0.000
0.920 | 0.948
0.000 | 0.000
6peptides
spectra
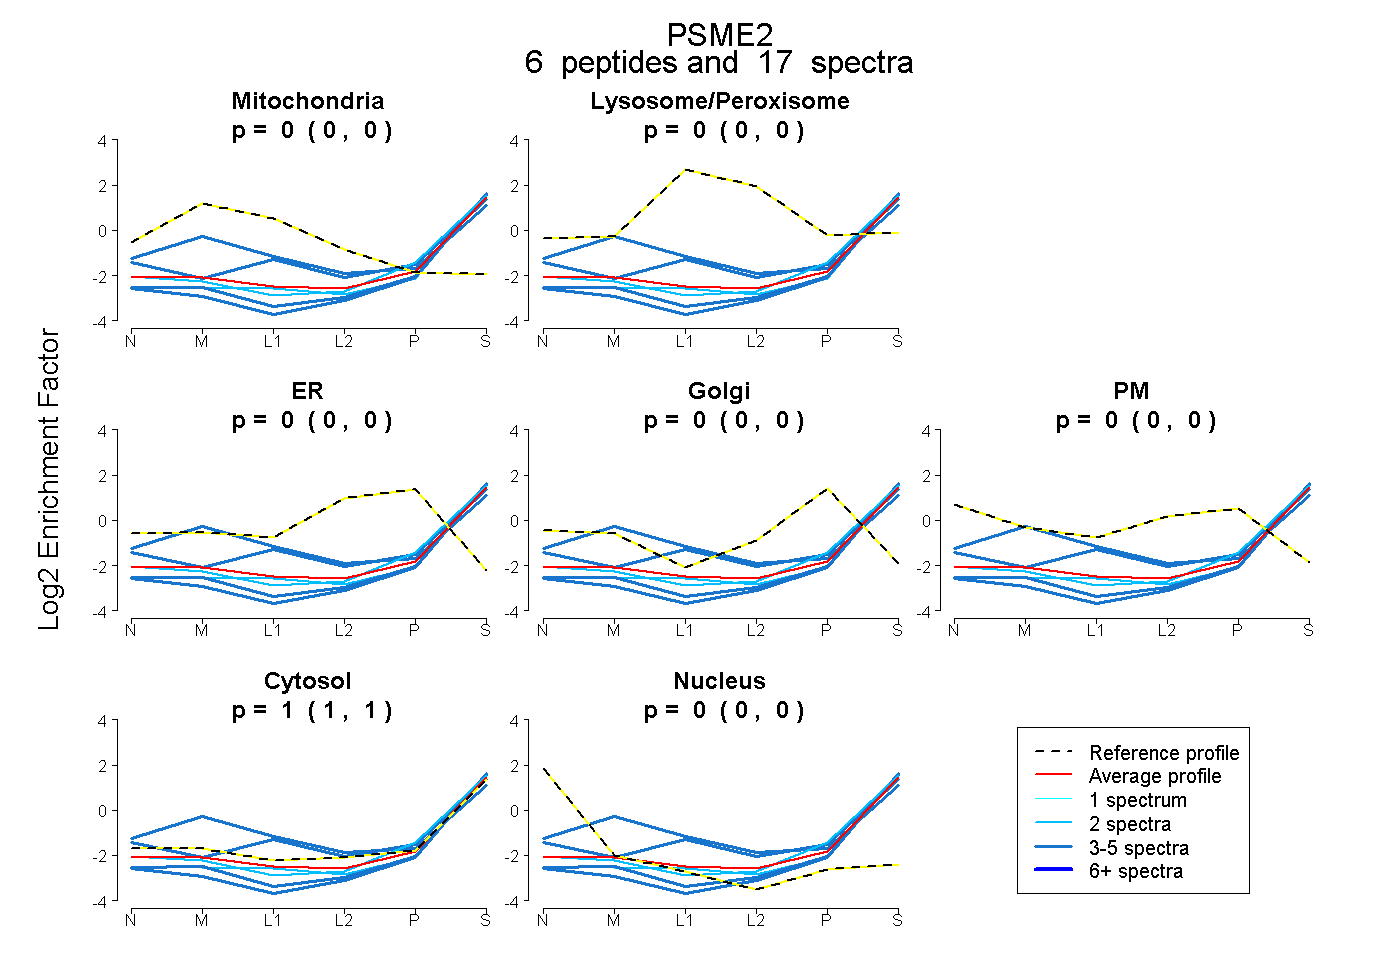
0.000 | 0.000
0.000 | 0.000
0.000 | 0.000
0.000 | 0.000
0.000 | 0.000
1.000 | 1.000
0.000 | 0.000
7peptides
spectra
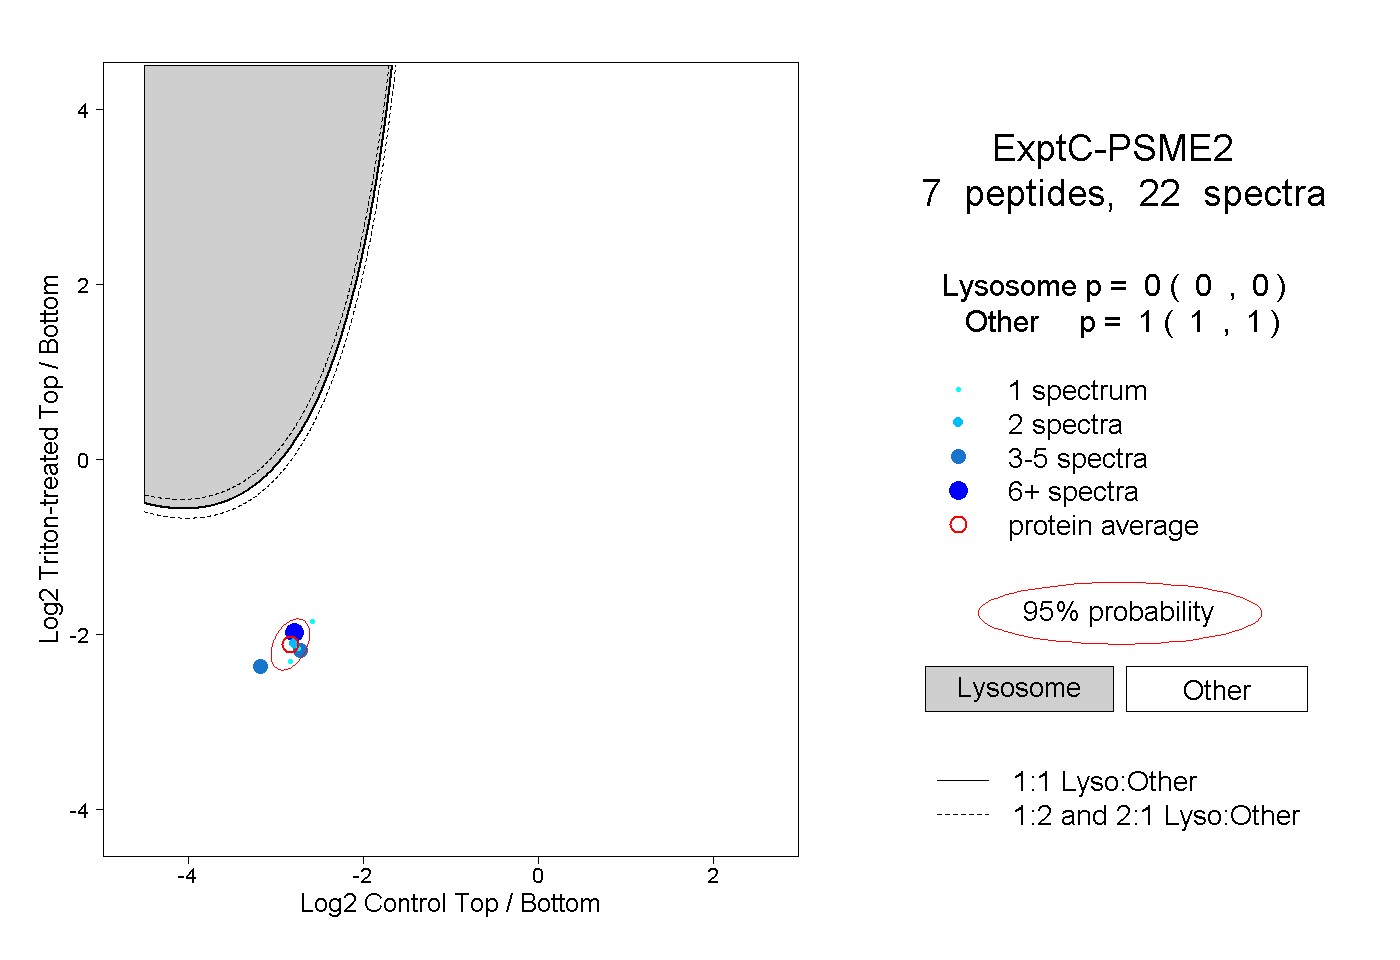
0.000 | 0.000
1.000 | 1.000