 6
6peptides
spectra
0.000 | 0.000
0.015 | 0.048
0.000 | 0.000
0.000 | 0.029
0.000 | 0.045
0.000 | 0.000
0.920 | 0.948
0.000 | 0.000
| Plot | Mito | Lyso | Perox | ER | Golgi | PM | Cytosol | Nucleus | |||||
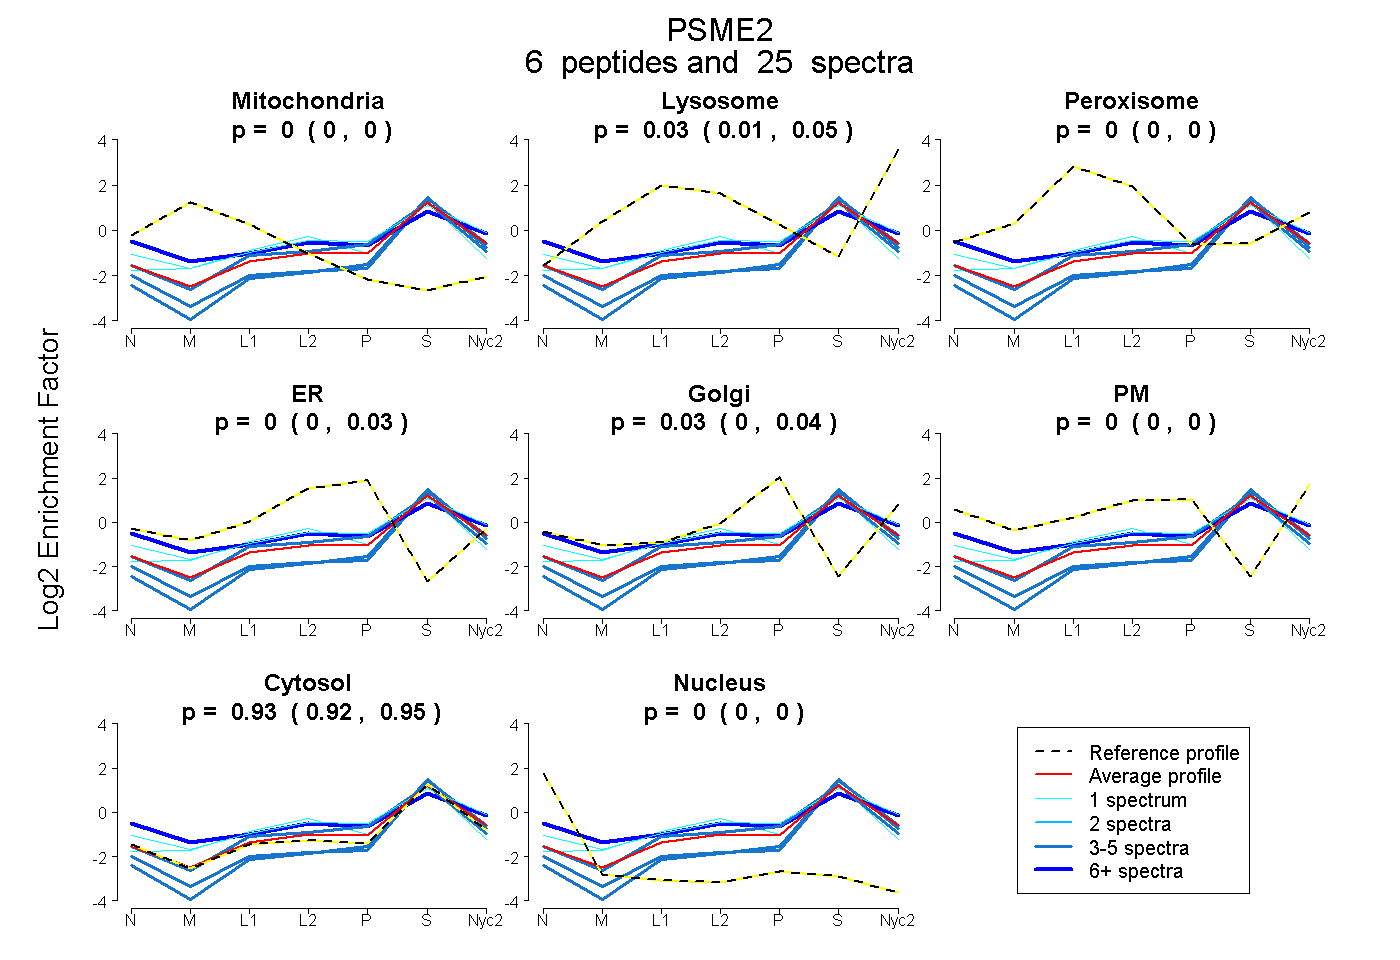
| Expt A |
6 peptides |
25 spectra |
|
0.000 0.000 | 0.000 |
0.034 0.015 | 0.048 |
0.000 0.000 | 0.000 |
0.000 0.000 | 0.029 |
0.031 0.000 | 0.045 |
0.000 0.000 | 0.000 |
0.935 0.920 | 0.948 |
0.000 0.000 | 0.000 |
| 1 spectrum, AFYAELHHIISSNLEK | 0.000 | 0.000 | 0.150 | 0.026 | 0.000 | 0.000 | 0.824 | 0.000 | ||
| 1 spectrum, QVDAFR | 0.000 | 0.108 | 0.043 | 0.011 | 0.050 | 0.040 | 0.748 | 0.000 | ||
| 4 spectra, GEEKPSMY | 0.000 | 0.000 | 0.000 | 0.093 | 0.000 | 0.000 | 0.907 | 0.000 | ||
| 11 spectra, DTHVMDYR | 0.000 | 0.000 | 0.076 | 0.000 | 0.000 | 0.216 | 0.708 | 0.000 | ||
| 4 spectra, DEAAYGALR | 0.000 | 0.000 | 0.000 | 0.000 | 0.000 | 0.000 | 1.000 | 0.000 | ||
| 4 spectra, AMVLDLR | 0.000 | 0.000 | 0.000 | 0.000 | 0.000 | 0.000 | 1.000 | 0.000 |
| Plot | Mito | Lyso or Perox | ER | Golgi | PM | Cytosol | Nucleus | ||||||
| Expt B |
6 peptides |
17 spectra |
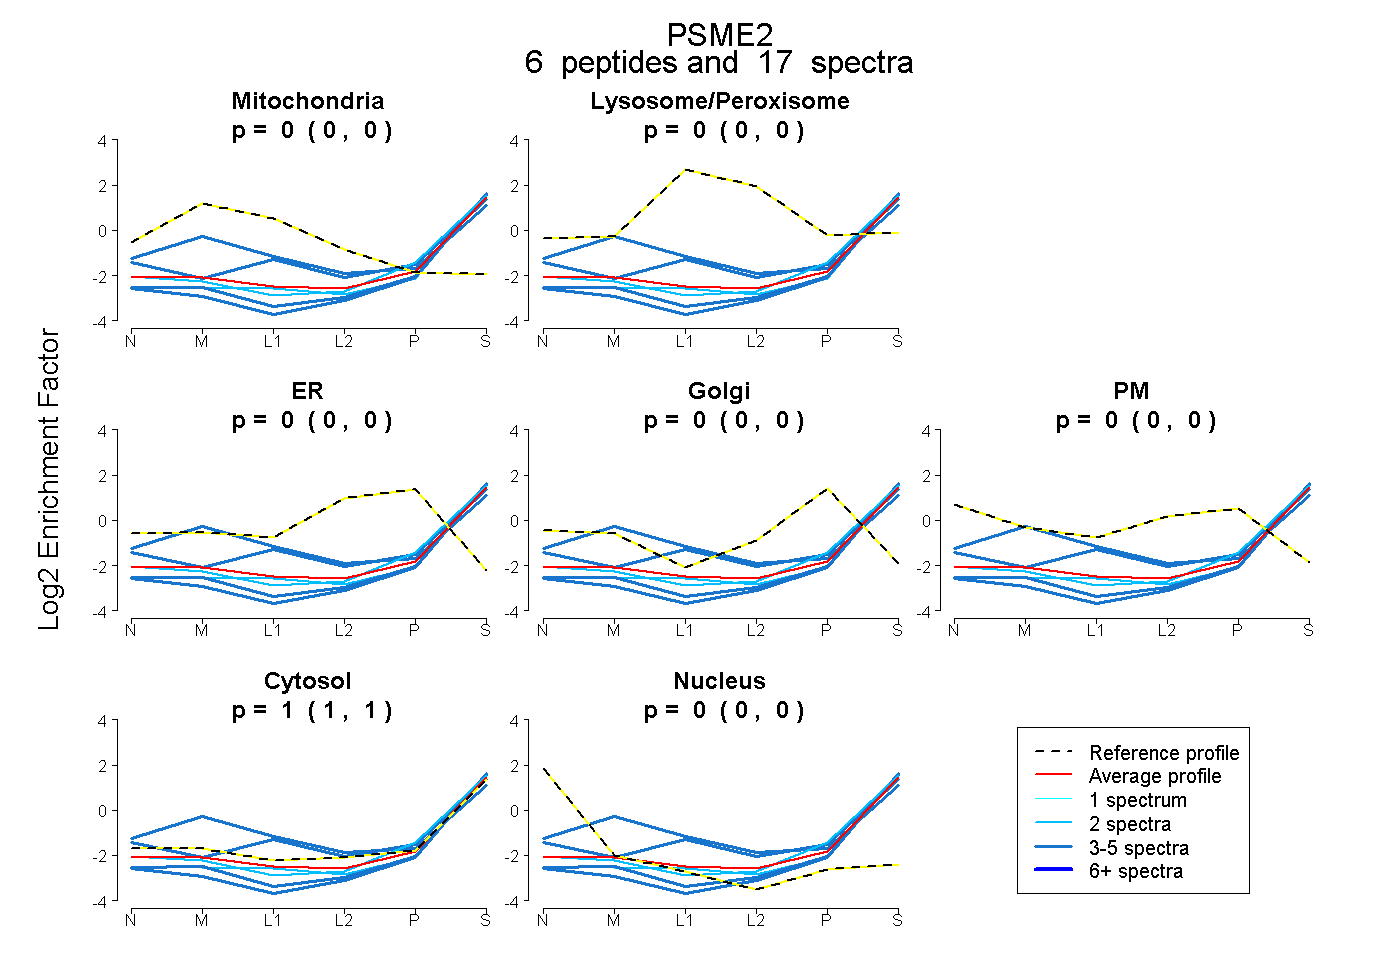 |
0.000 0.000 | 0.000 |
0.000 0.000 | 0.000 |
0.000 0.000 | 0.000 |
0.000 0.000 | 0.000 |
0.000 0.000 | 0.000 |
1.000 1.000 | 1.000 |
0.000 0.000 | 0.000 |
|||
| Plot | Lyso | Other | |||||||||||
| Expt C |
7 peptides |
22 spectra |
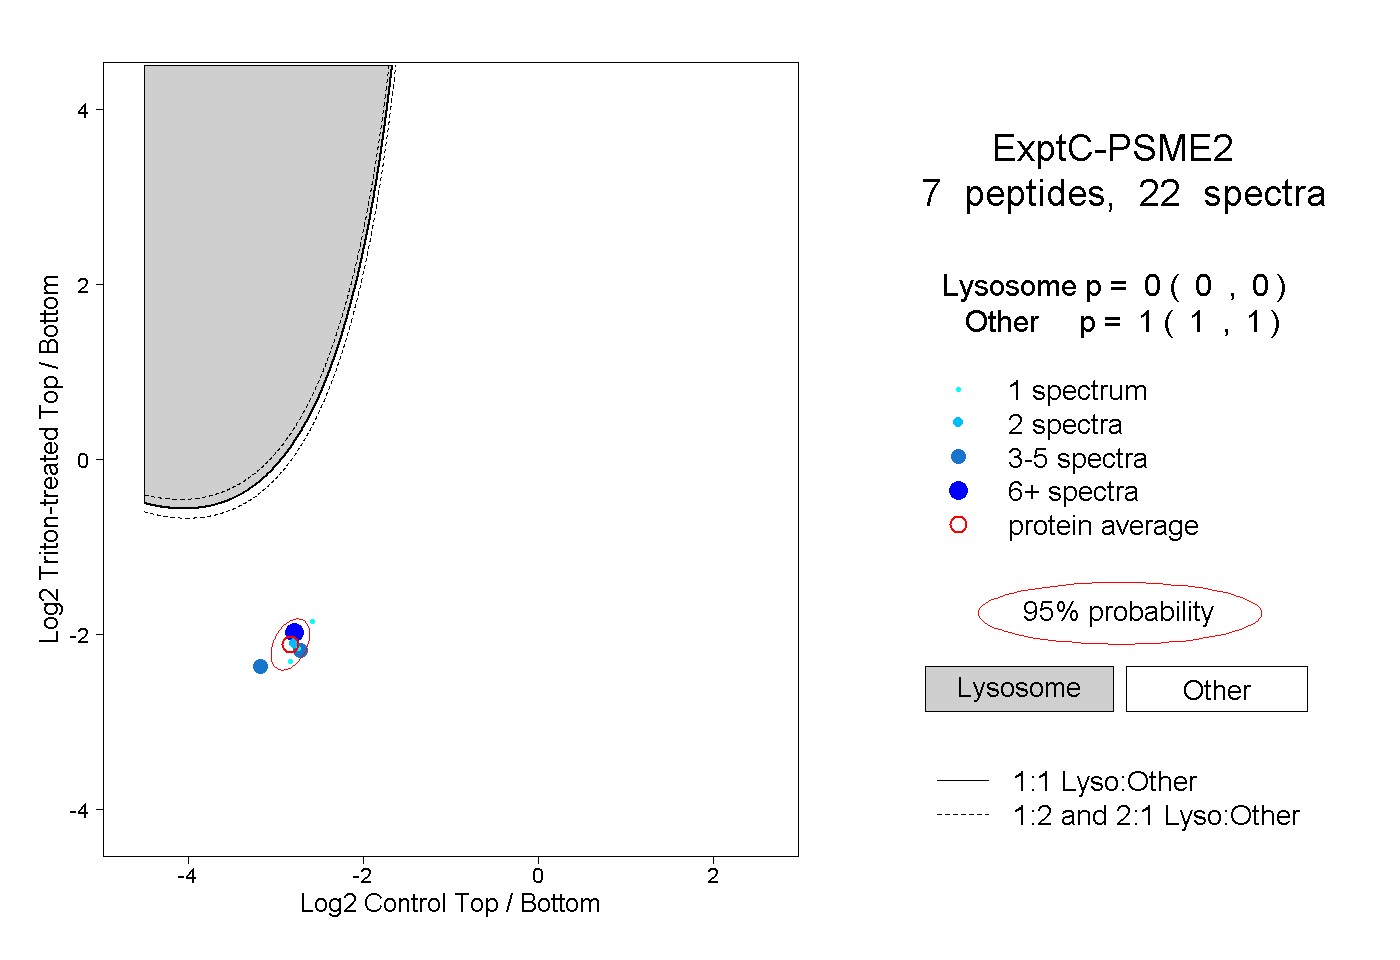 |
0.000 0.000 | 0.000 |
1.000 1.000 | 1.000 |
||||||||
| Plot | Lyso | Other | |||||||||||
| Expt D |
1 peptide |
1 spectrum |
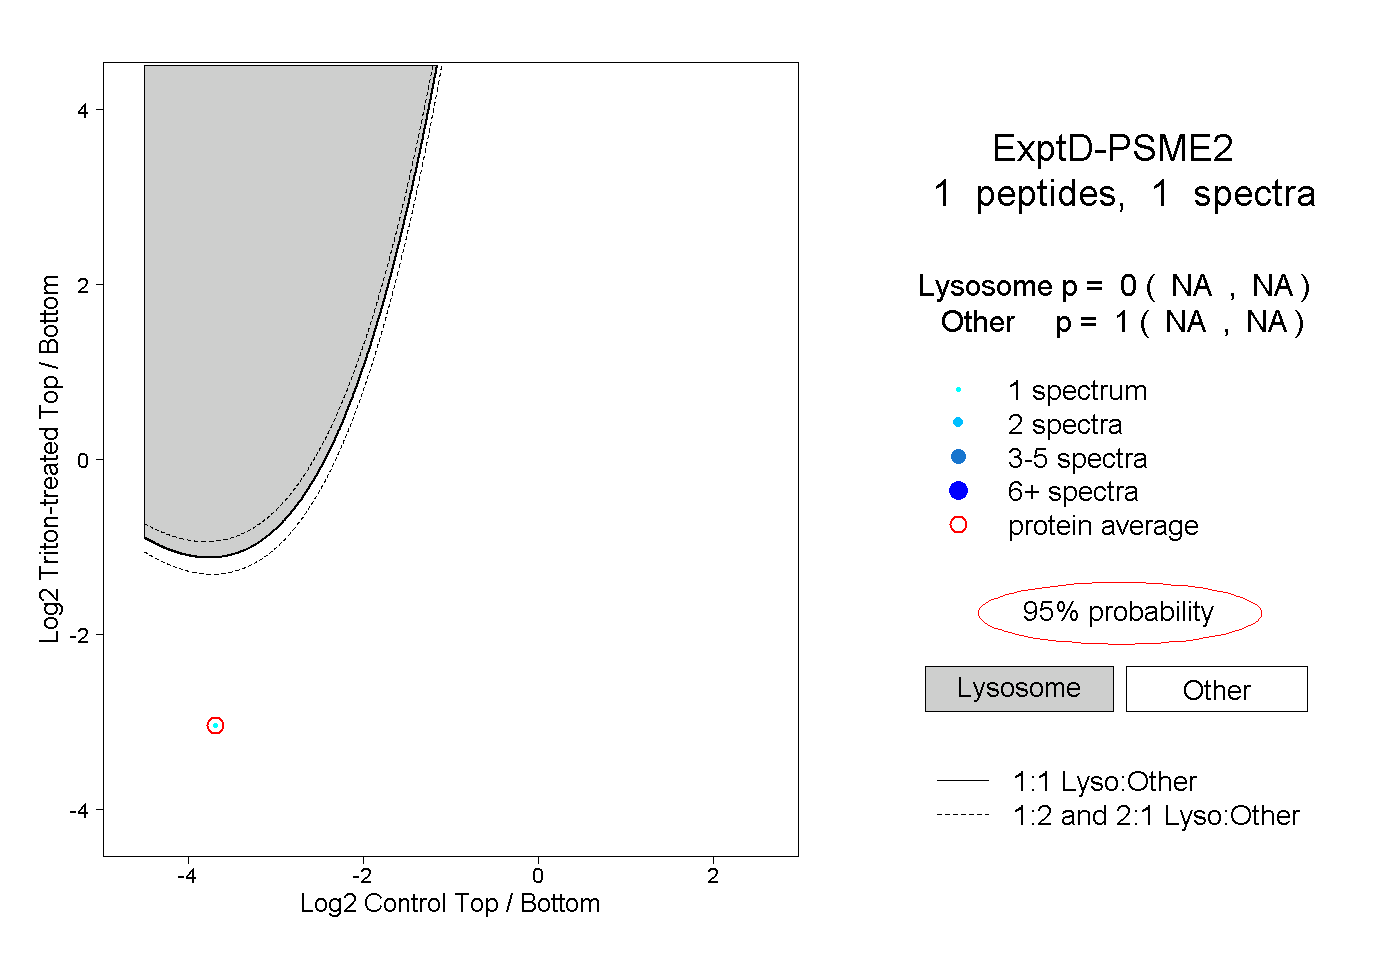 |
0.000 NA | NA |
1.000 NA | NA |