 3
3peptides
spectra
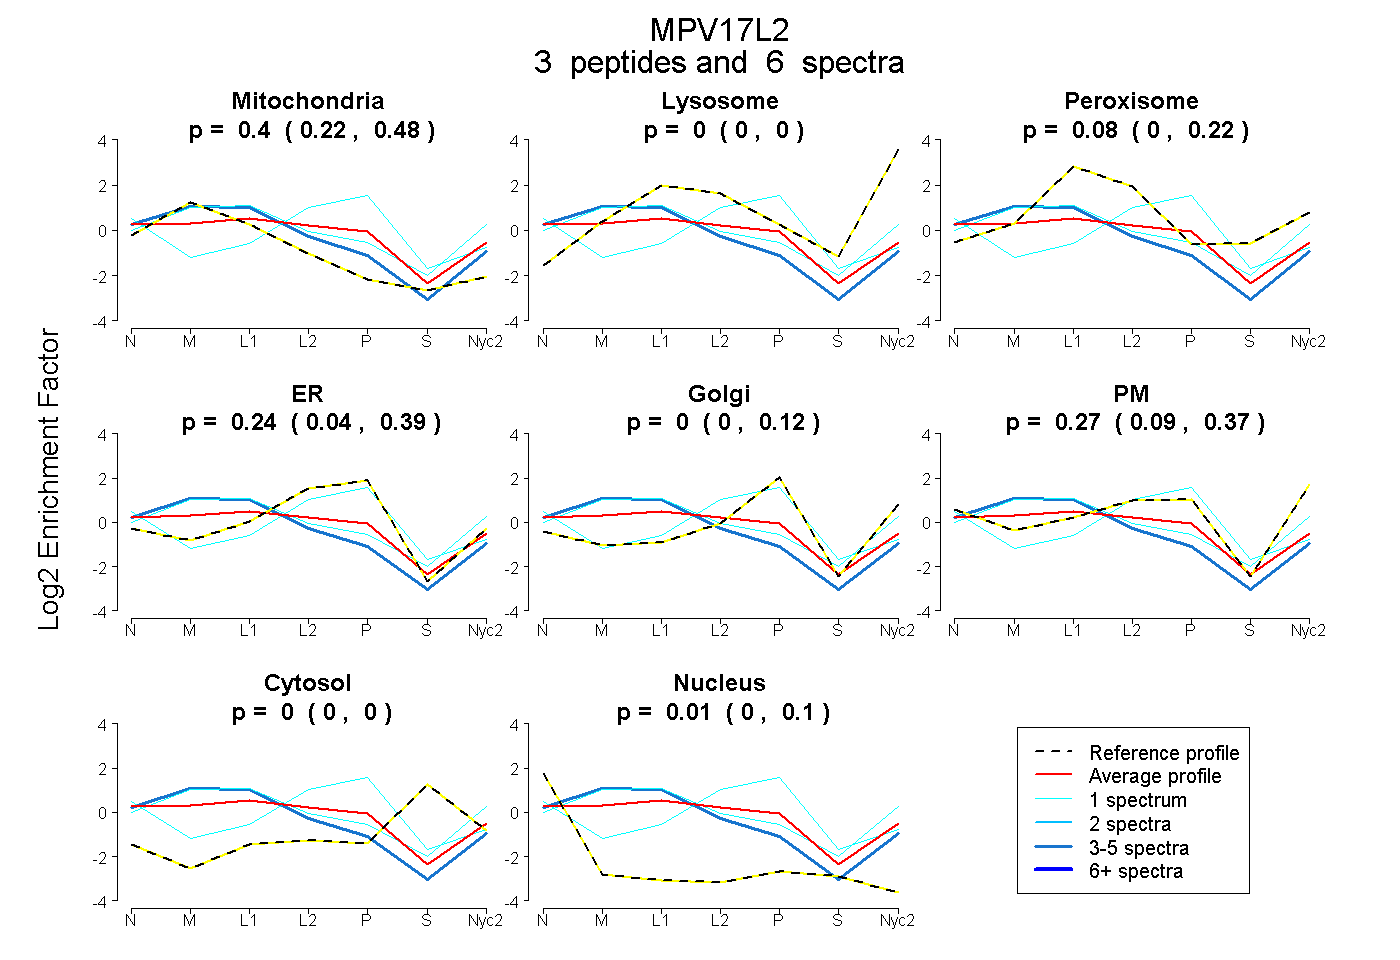
0.220 | 0.480
0.000 | 0.000
0.000 | 0.224
0.041 | 0.385
0.000 | 0.116
0.094 | 0.367
0.000 | 0.000
0.000 | 0.102
2peptides
spectra
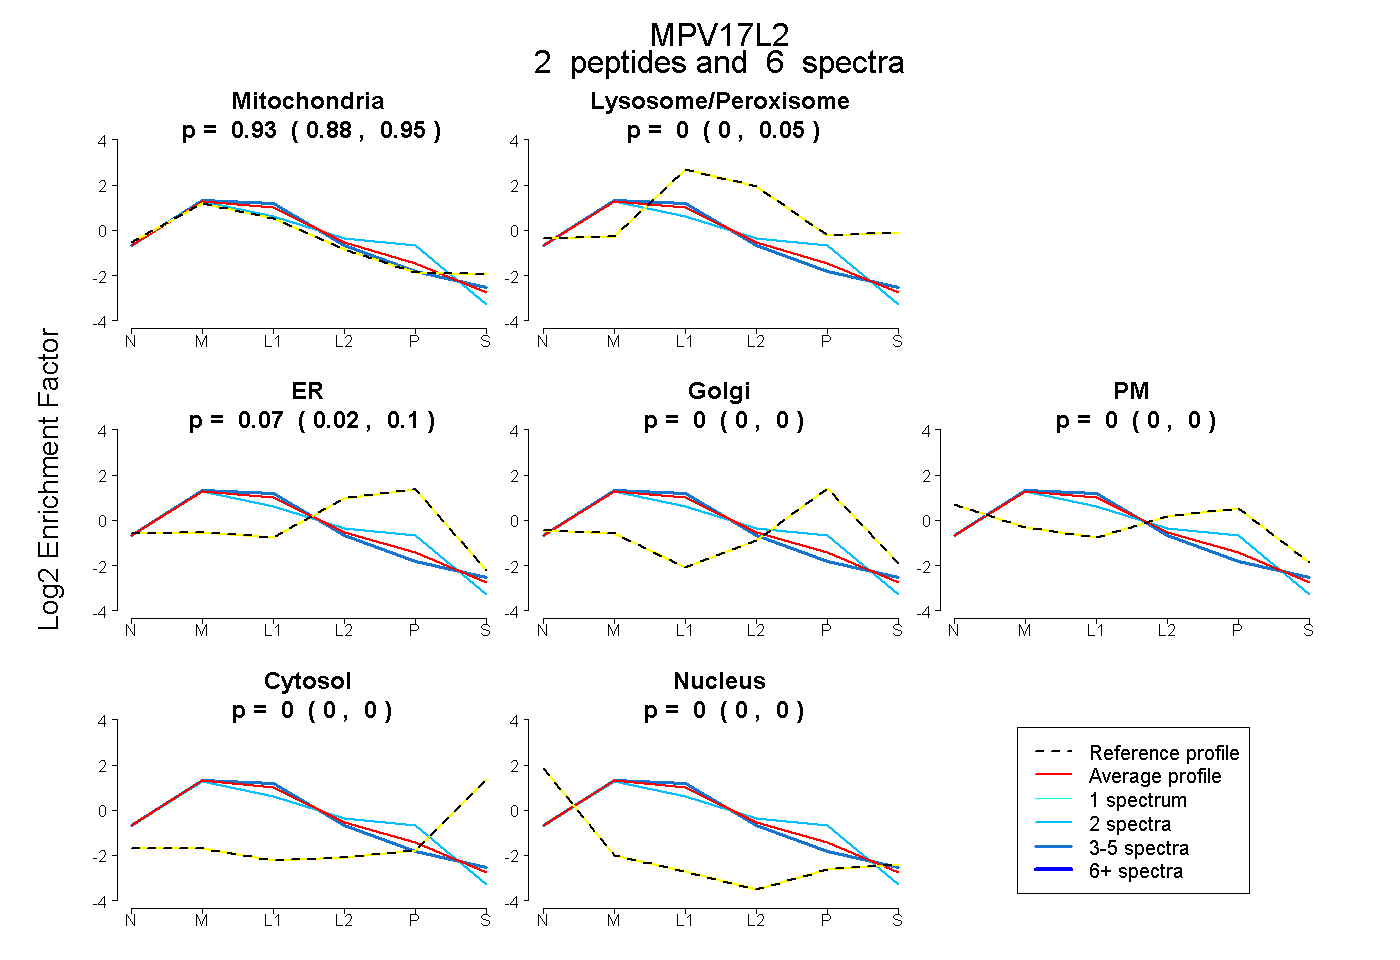
0.882 | 0.952
0.000 | 0.055
0.017 | 0.100
0.000 | 0.000
0.000 | 0.000
0.000 | 0.000
0.000 | 0.000
5peptides
spectra
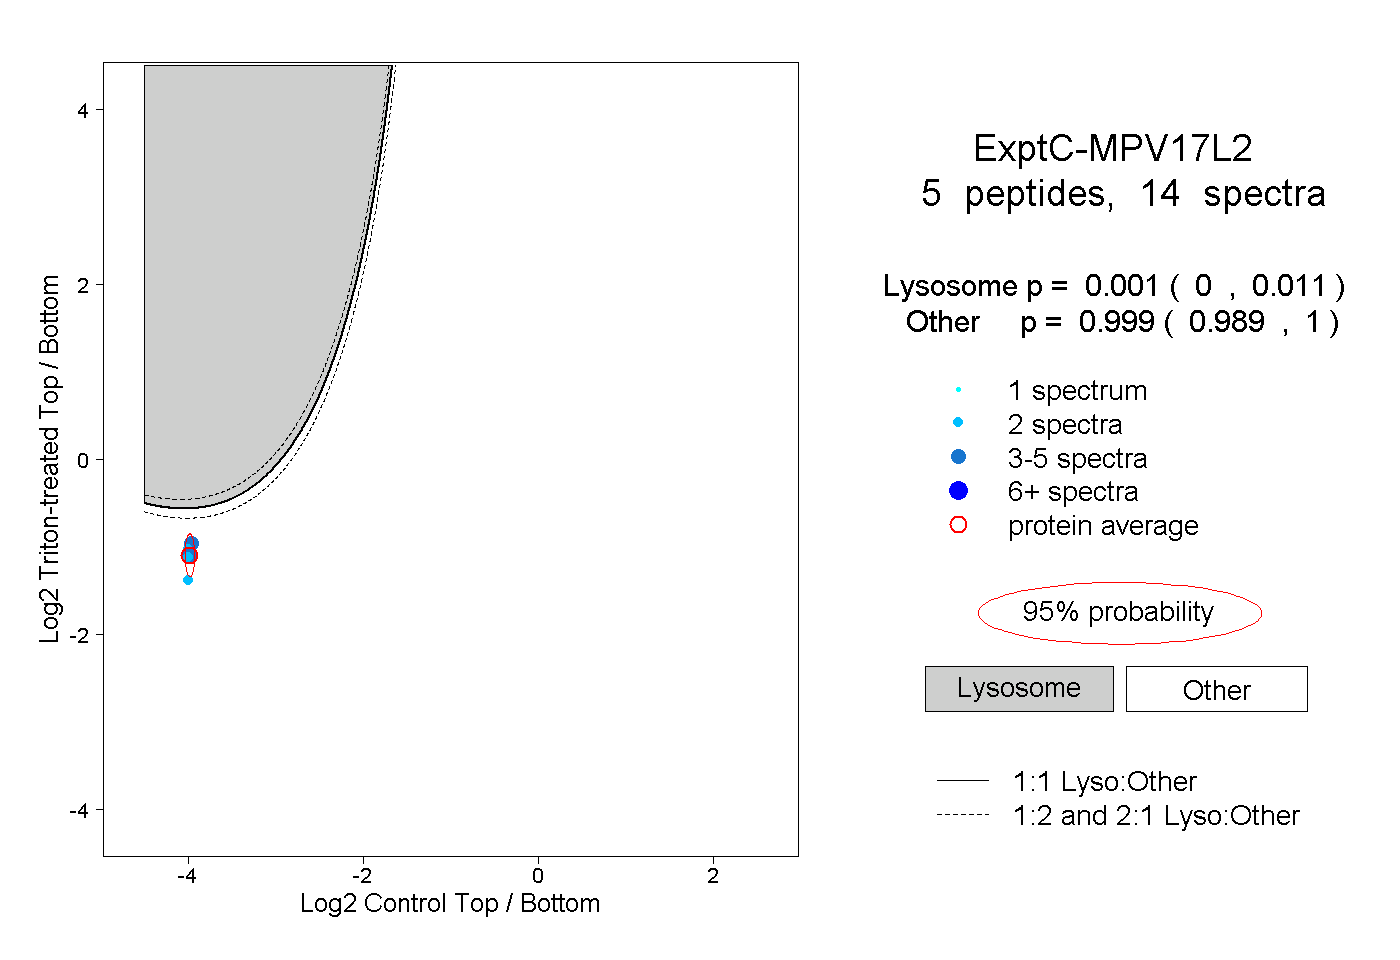
0.000 | 0.011
0.989 | 1.000