MPV17L2
[ENSRNOP00000026271]
Main page
| | | Plot |
Mito |
Lyso |
|
Perox |
ER |
Golgi |
PM |
Cytosol |
Nucleus |
|
| Expt A |
 3
3
peptides |
6
spectra |
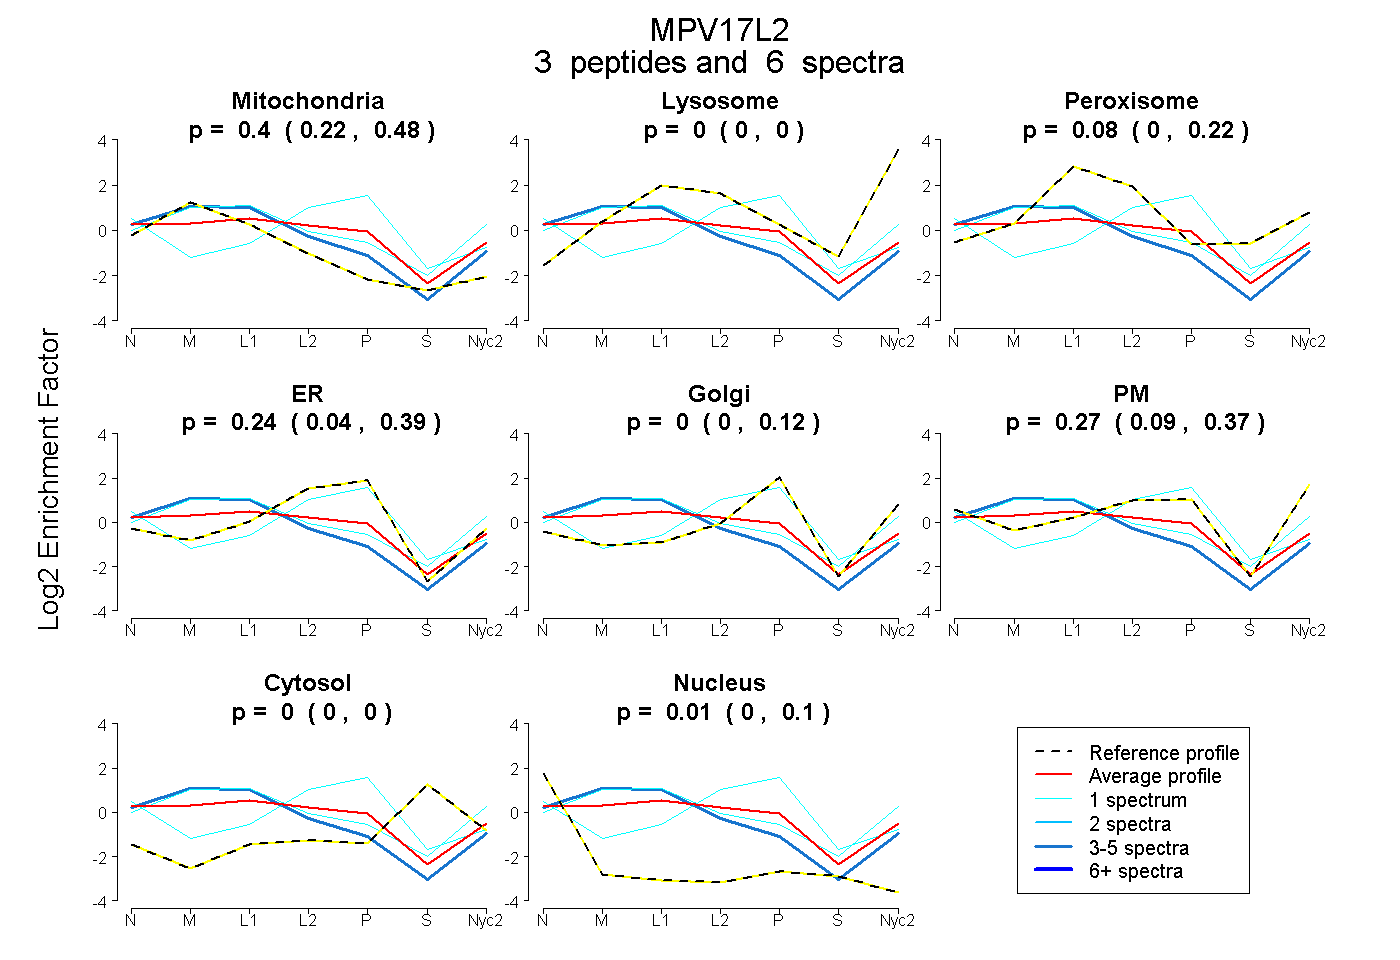 |
0.398
0.220 | 0.480 |
0.000
0.000 | 0.000 |
|
0.084
0.000 | 0.224 |
0.239
0.041 | 0.385 |
0.000
0.000 | 0.116 |
0.266
0.094 | 0.367 |
0.000
0.000 | 0.000 |
0.013
0.000 | 0.102 |
|
| | | Plot |
Mito |
|
Lyso or Perox |
|
ER |
Golgi |
PM |
Cytosol |
Nucleus |
|
| Expt B |
2
peptides |
6
spectra |
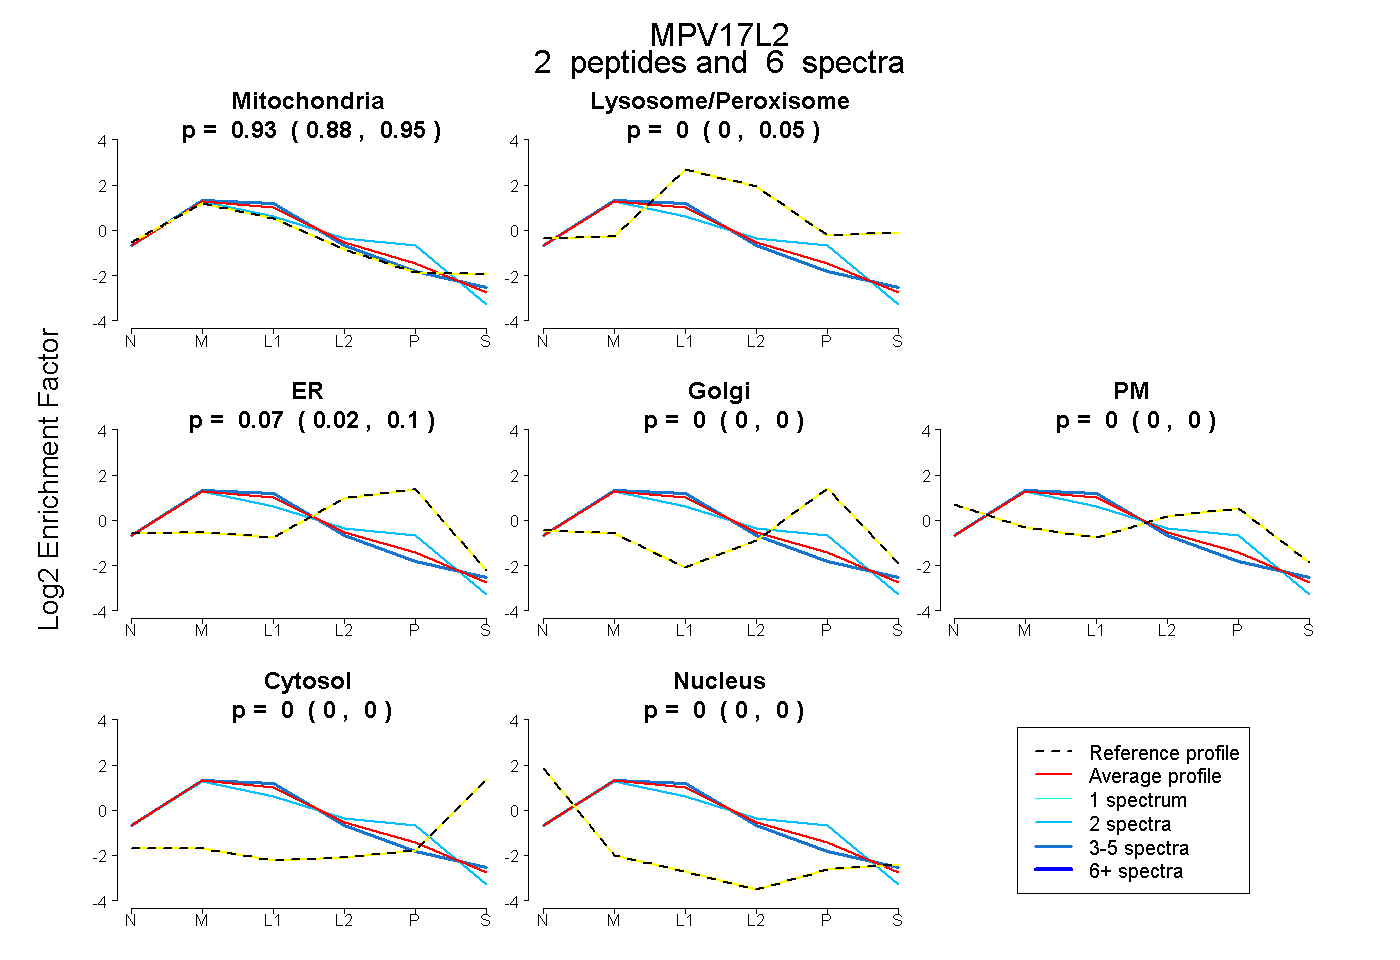 |
0.926
0.882 | 0.952 |
|
0.005
0.000 | 0.055 |
|
0.070
0.017 | 0.100 |
0.000
0.000 | 0.000 |
0.000
0.000 | 0.000 |
0.000
0.000 | 0.000 |
0.000
0.000 | 0.000 |
|
| 4 spectra, ALAAGRPLFQGR |
0.965 |
|
0.035 |
|
0.000 |
0.000 |
0.000 |
0.000 |
0.000 |
|
| 2 spectra, LLPASGLR |
0.740 |
|
0.000 |
|
0.260 |
0.000 |
0.000 |
0.000 |
0.000 |
|
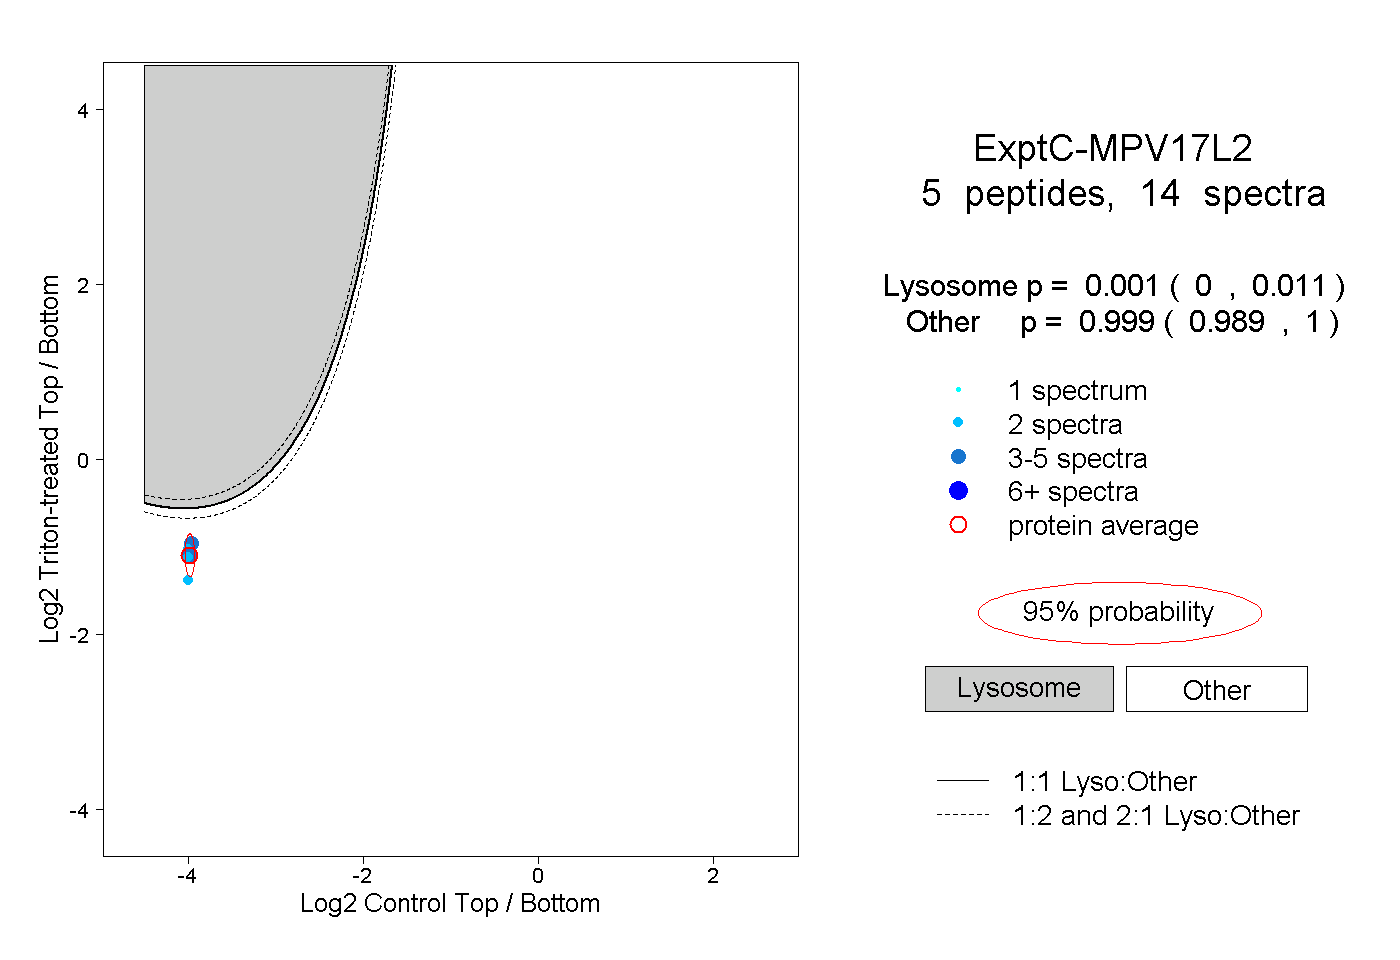
| | | Plot |
|
Lyso |
|
|
|
|
|
|
|
Other |
| Expt C |
5
peptides |
14
spectra |
 |
|
0.001
0.000 | 0.011 |
|
|
|
|
|
|
|
0.999
0.989 | 1.000 |