 6
6peptides
spectra
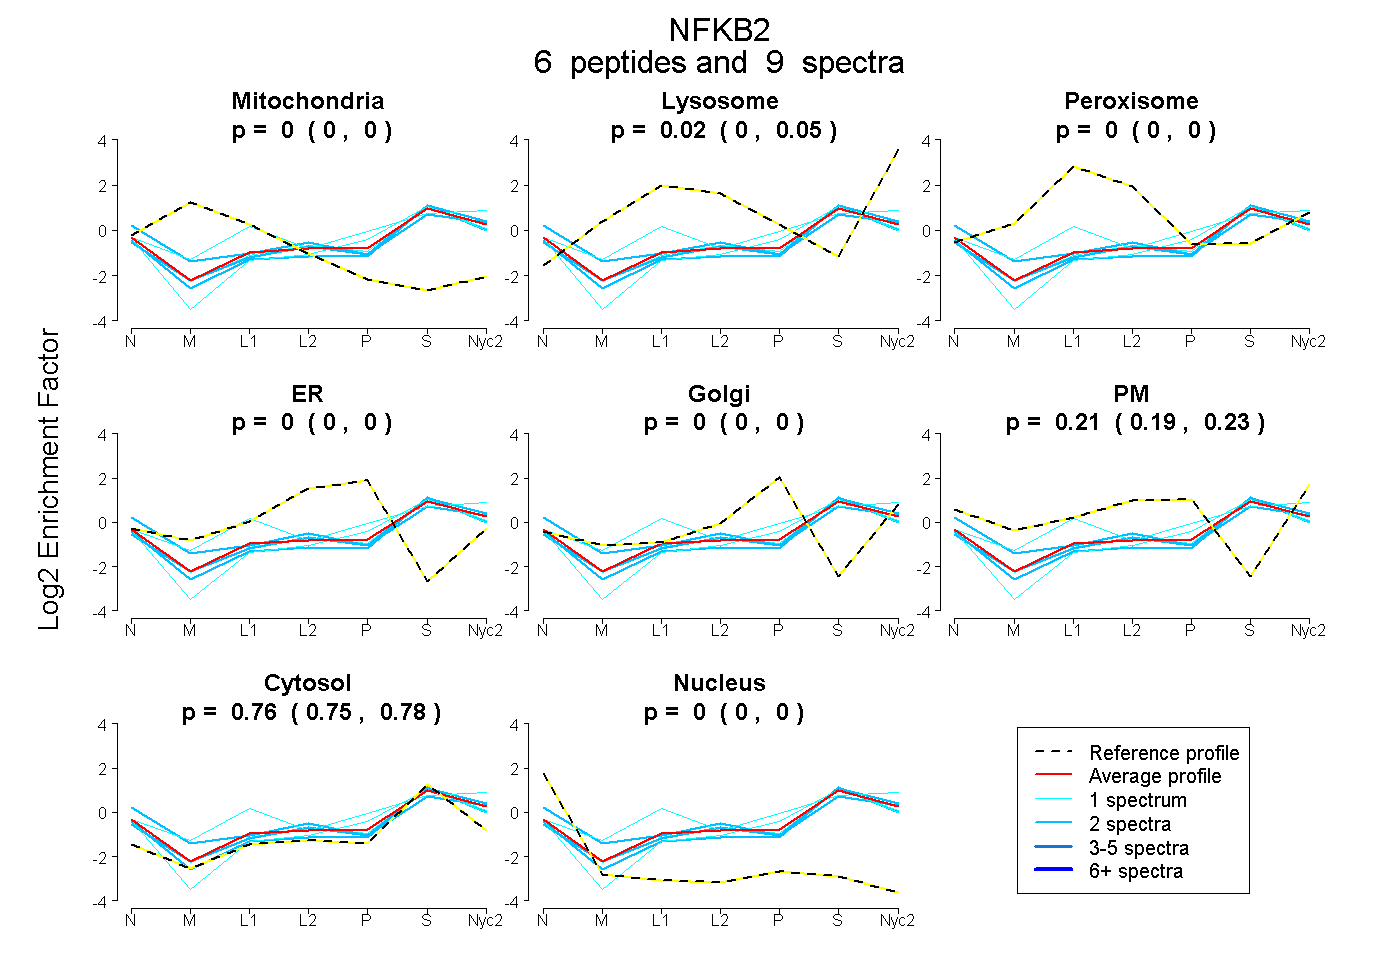
0.000 | 0.000
0.000 | 0.046
0.000 | 0.000
0.000 | 0.000
0.000 | 0.000
0.190 | 0.233
0.746 | 0.776
0.000 | 0.000
| Plot | Mito | Lyso | Perox | ER | Golgi | PM | Cytosol | Nucleus | |||||
| Expt A |
6 peptides |
9 spectra |
|
0.000 0.000 | 0.000 |
0.024 0.000 | 0.046 |
0.000 0.000 | 0.000 |
0.000 0.000 | 0.000 |
0.000 0.000 | 0.000 |
0.214 0.190 | 0.233 |
0.763 0.746 | 0.776 |
0.000 0.000 | 0.000 |
| 1 spectrum, TFAGNTPLHLAAGLGSPTLTR | 0.000 | 0.000 | 0.000 | 0.000 | 0.120 | 0.048 | 0.833 | 0.000 | ||
| 2 spectra, LFGLAQR | 0.000 | 0.076 | 0.000 | 0.000 | 0.000 | 0.130 | 0.794 | 0.000 | ||
| 2 spectra, FSAFLR | 0.000 | 0.000 | 0.054 | 0.000 | 0.000 | 0.281 | 0.647 | 0.018 | ||
| 2 spectra, ALLAGQR | 0.000 | 0.000 | 0.000 | 0.000 | 0.000 | 0.133 | 0.864 | 0.003 | ||
| 1 spectrum, TPSPSGSLLR | 0.000 | 0.200 | 0.049 | 0.000 | 0.000 | 0.188 | 0.563 | 0.000 | ||
| 1 spectrum, DDIEVR | 0.000 | 0.010 | 0.009 | 0.000 | 0.000 | 0.170 | 0.811 | 0.000 |
| Plot | Lyso | Other | |||||||||||
| Expt C |
2 peptides |
4 spectra |
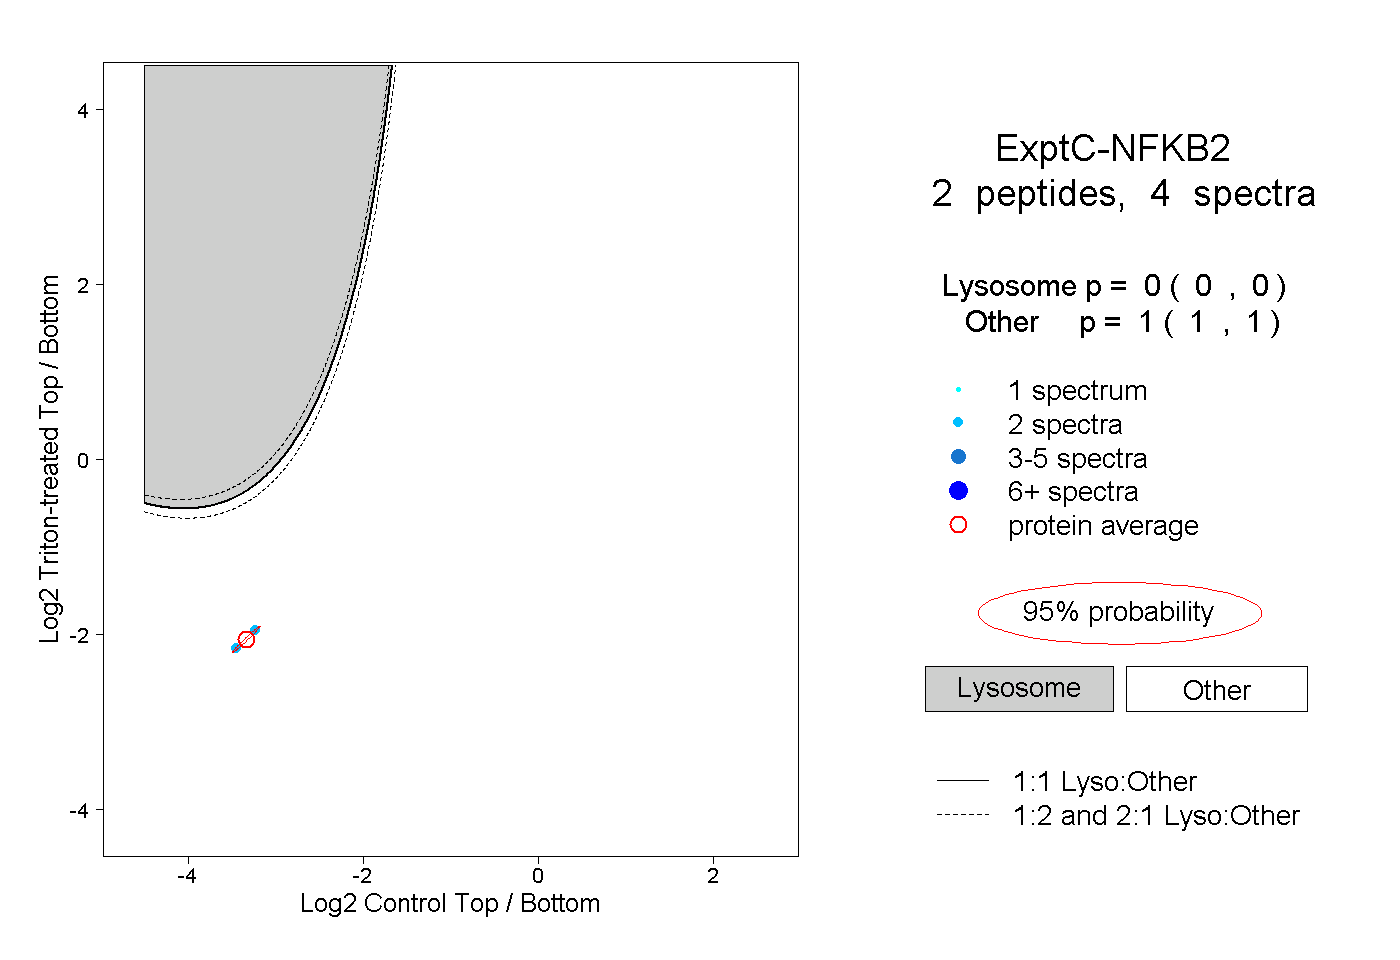 |
0.000 0.000 | 0.000 |
1.000 1.000 | 1.000 |