 3
3peptides
spectra
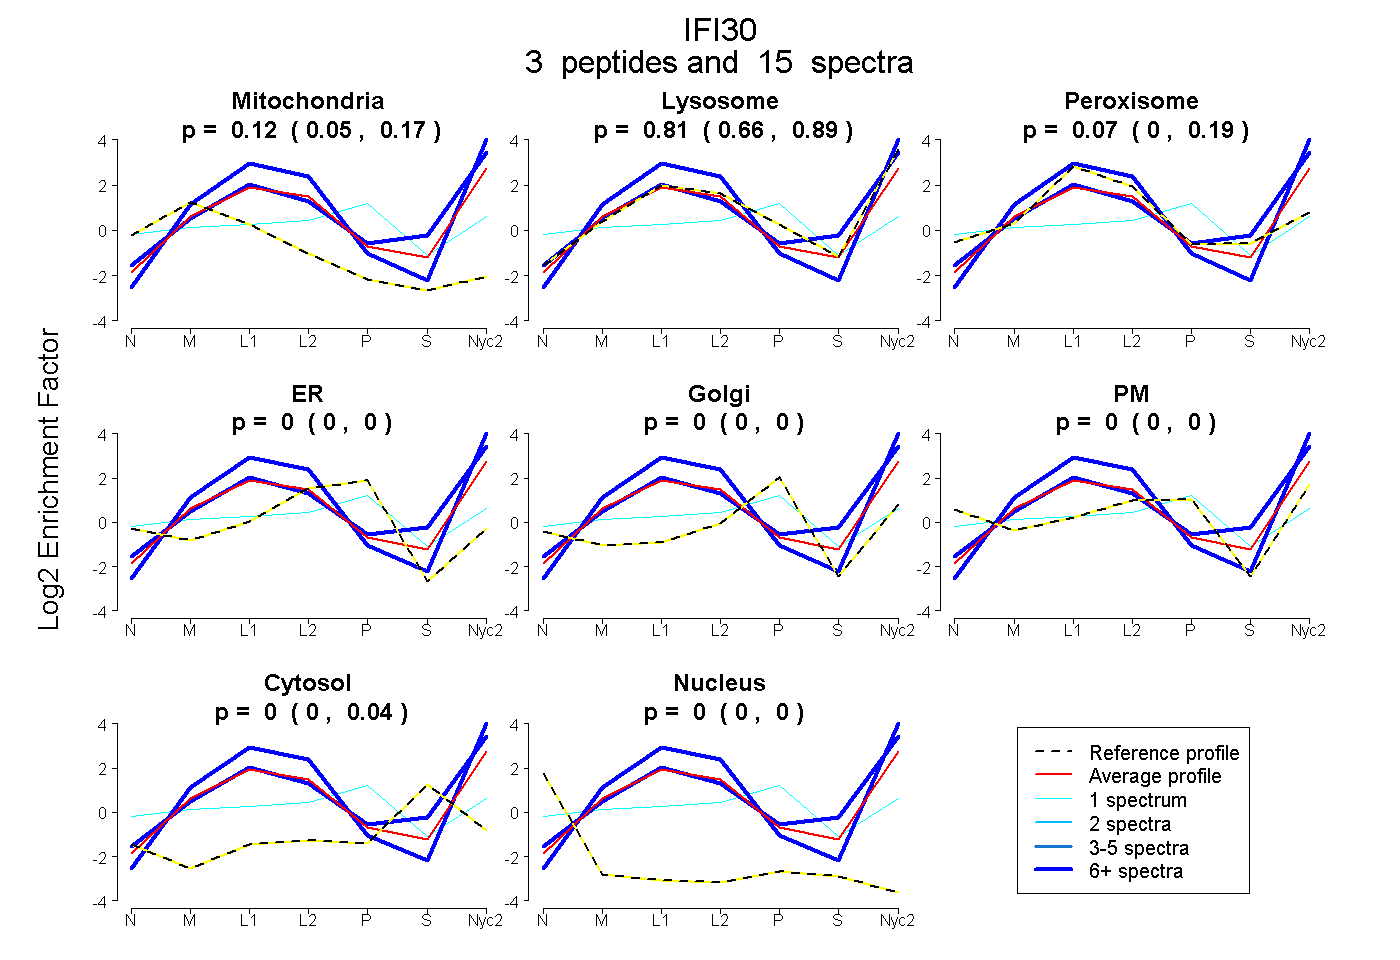
0.054 | 0.165
0.662 | 0.894
0.000 | 0.191
0.000 | 0.000
0.000 | 0.000
0.000 | 0.000
0.000 | 0.036
0.000 | 0.000
1peptide
spectrum
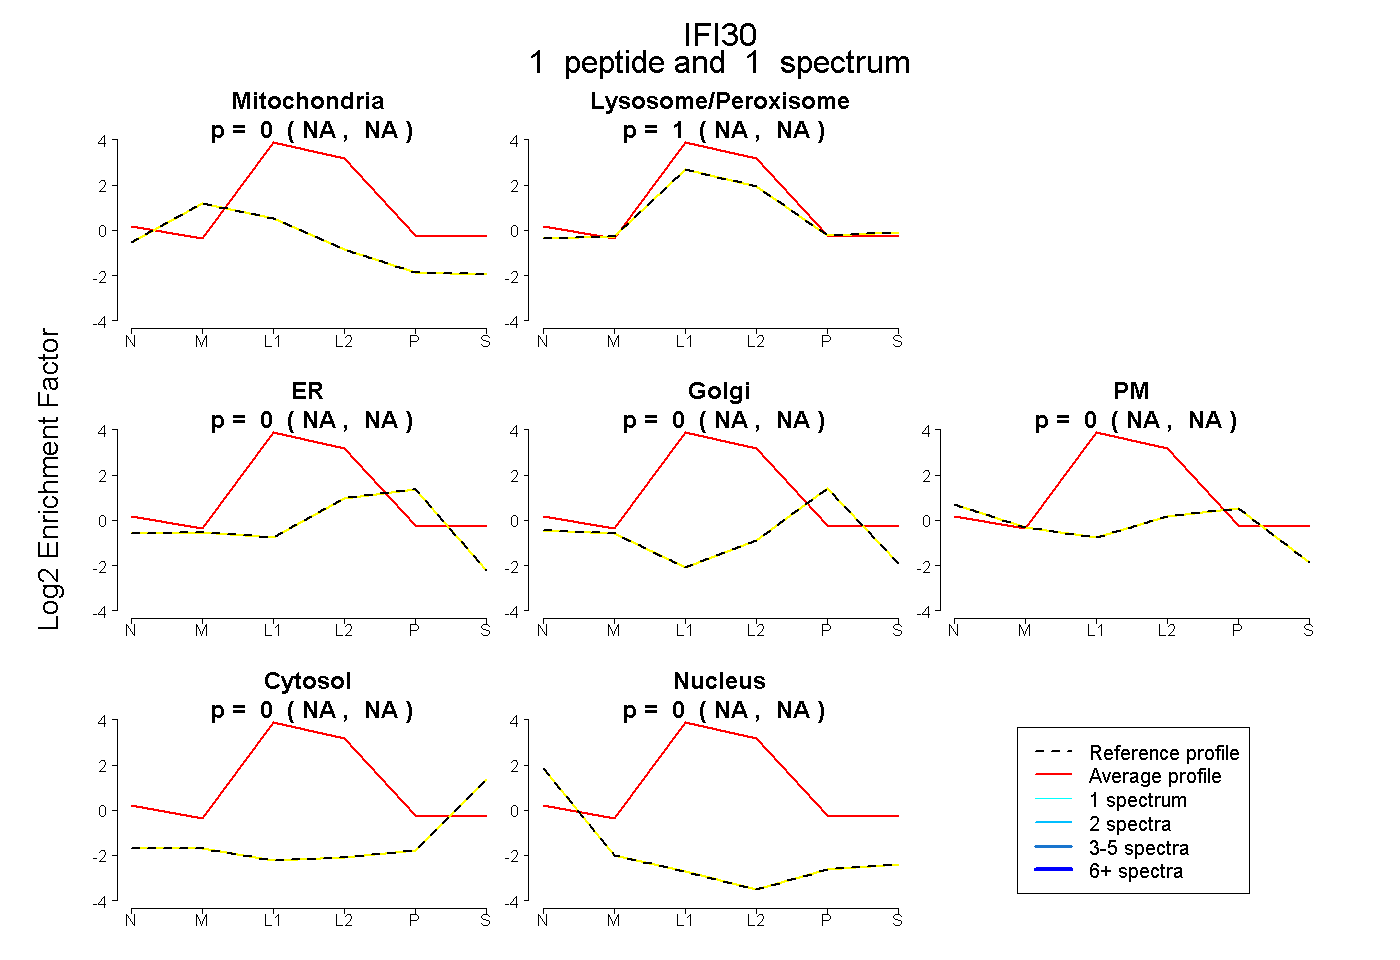
NA | NA
NA | NA
NA | NA
NA | NA
NA | NA
NA | NA
NA | NA
2peptides
spectra
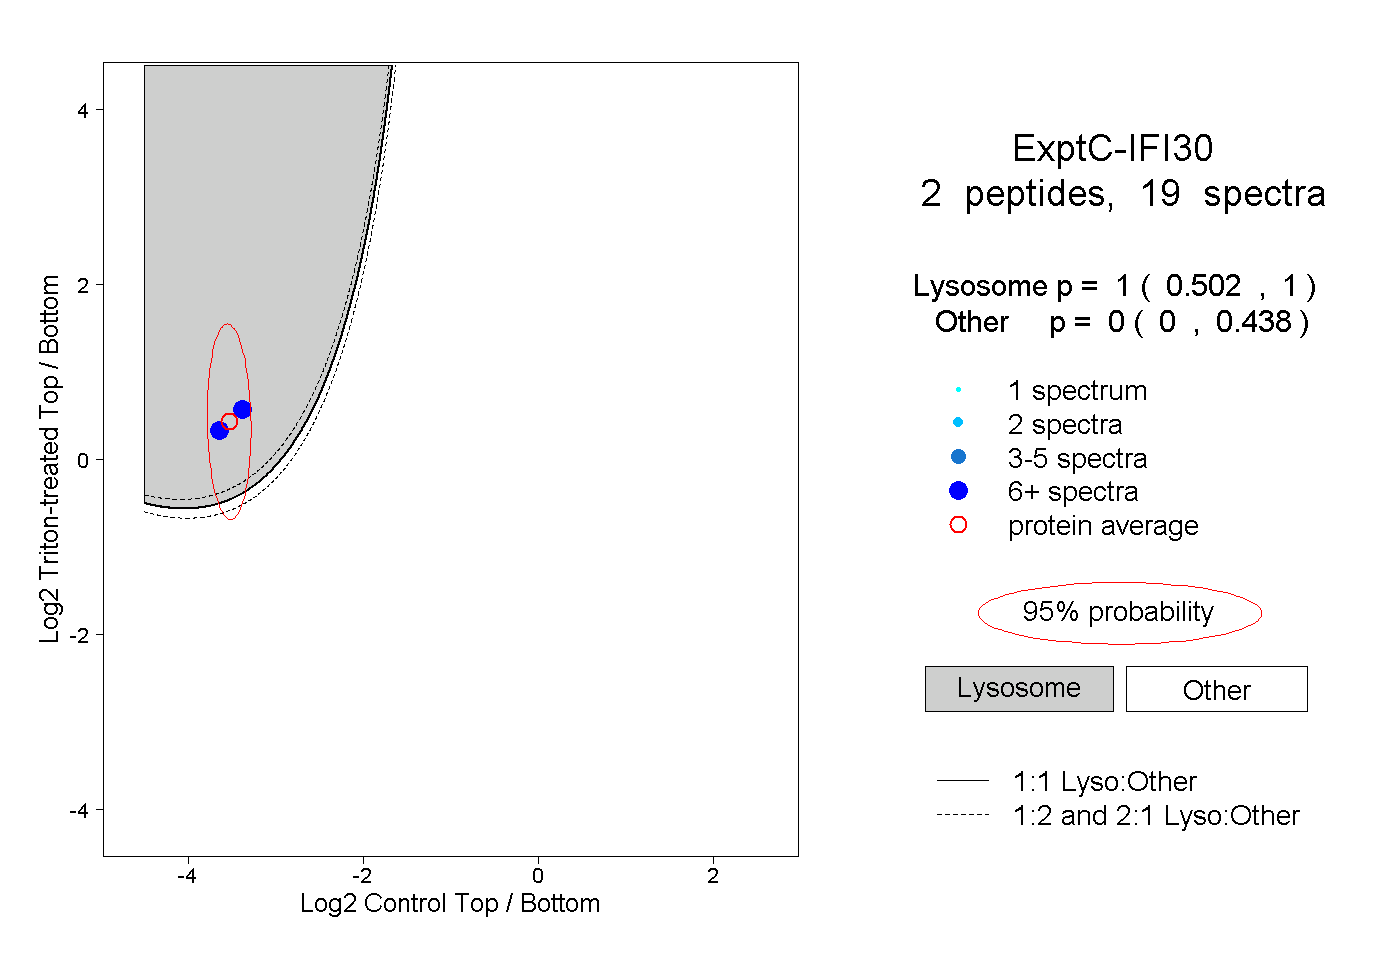
0.502 | 1.000
0.000 | 0.438
1peptide
spectra
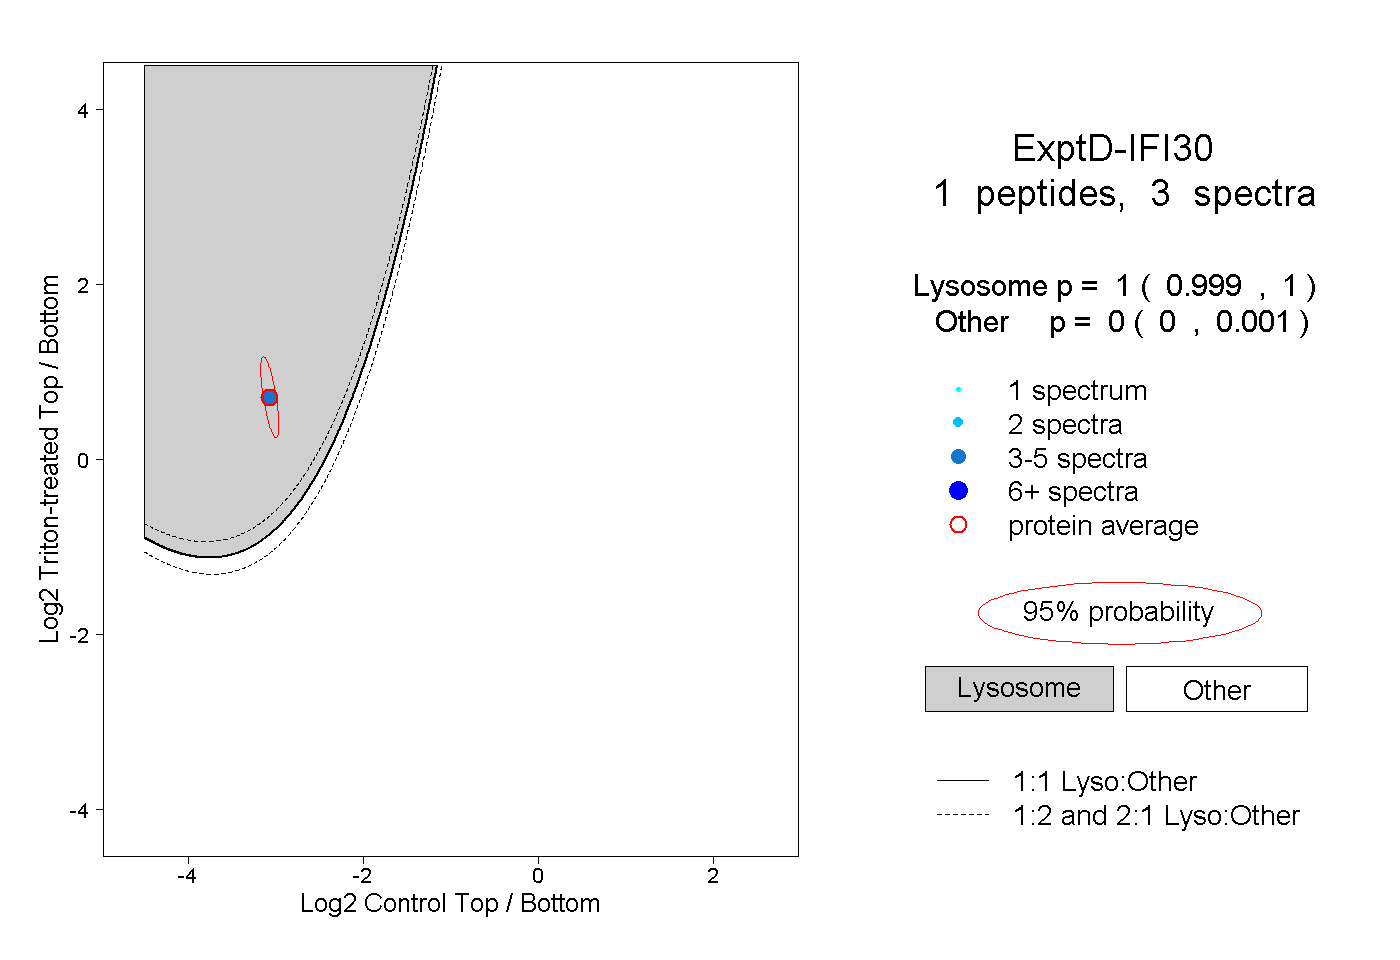
0.999 | 1.000
0.000 | 0.001