 2
2peptides
spectra
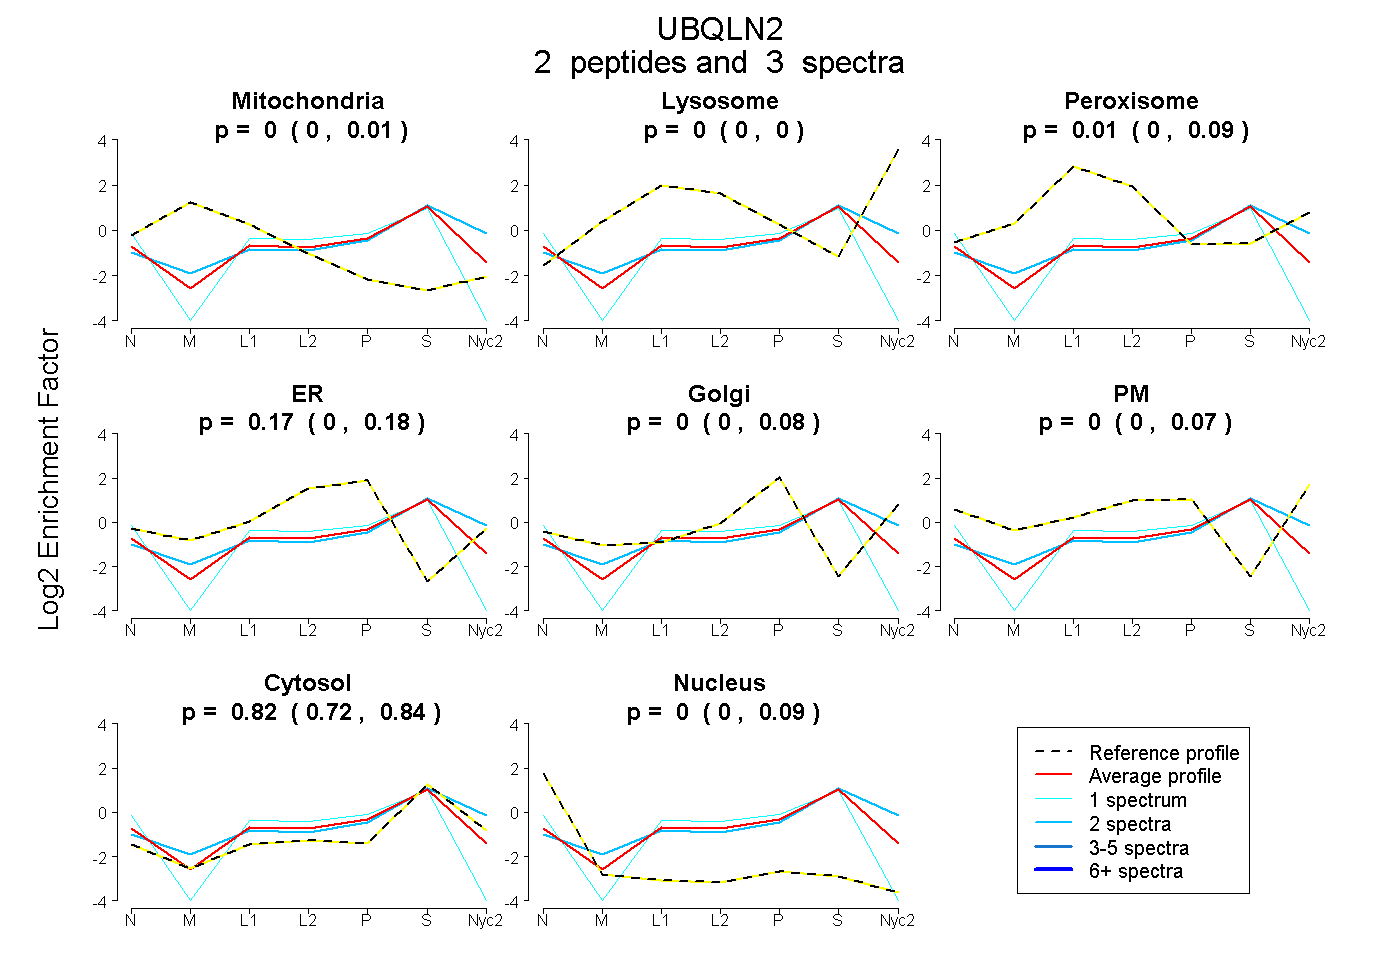
0.000 | 0.007
0.000 | 0.000
0.000 | 0.088
0.000 | 0.183
0.000 | 0.078
0.000 | 0.069
0.721 | 0.842
0.000 | 0.092
1peptide
spectra
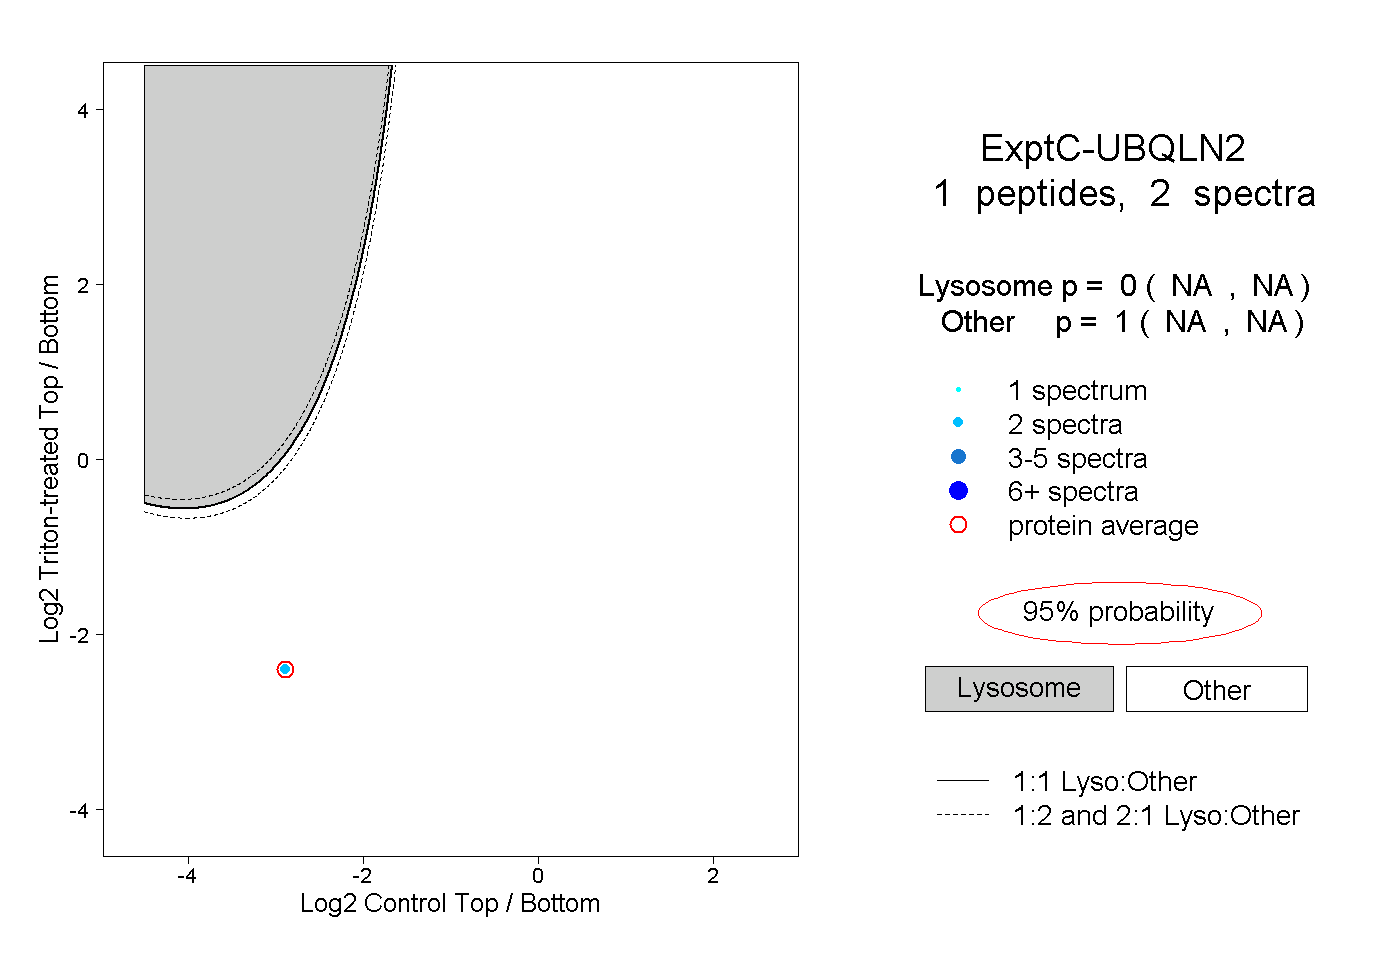
NA | NA
NA | NA
| Plot | Mito | Lyso | Perox | ER | Golgi | PM | Cytosol | Nucleus | |||||
| Expt A |
2 peptides |
3 spectra |
|
0.000 0.000 | 0.007 |
0.000 0.000 | 0.000 |
0.005 0.000 | 0.088 |
0.174 0.000 | 0.183 |
0.000 0.000 | 0.078 |
0.000 0.000 | 0.069 |
0.817 0.721 | 0.842 |
0.004 0.000 | 0.092 |
||
| Plot | Lyso | Other | |||||||||||
| Expt C |
1 peptide |
2 spectra |
|
0.000 NA | NA |
1.000 NA | NA |
| 2 spectra, GPAAAPGAANPPAEPK | 0.000 | 1.000 |