 1
1peptide
spectra
0.000 | 0.000
0.374 | 0.401
0.000 | 0.000
0.000 | 0.000
0.000 | 0.012
0.483 | 0.528
0.089 | 0.111
0.000 | 0.000
2peptides
spectra
0.000 | 0.000
1.000 | 1.000
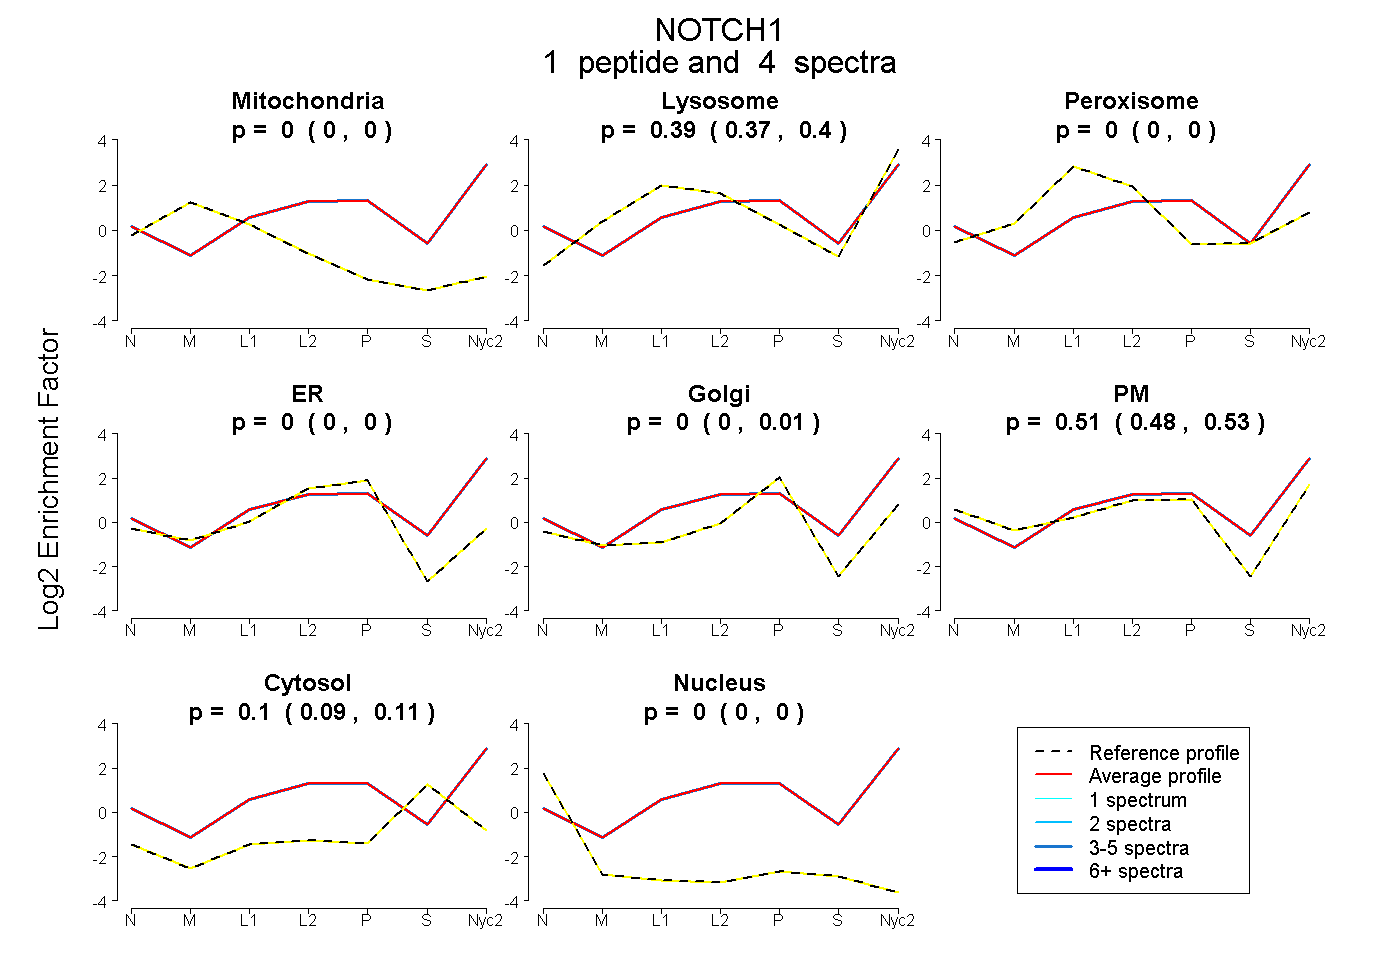
| Plot | Mito | Lyso | Perox | ER | Golgi | PM | Cytosol | Nucleus | |||||
| Expt A |
1 peptide |
4 spectra |
|
0.000 0.000 | 0.000 |
0.389 0.374 | 0.401 |
0.000 0.000 | 0.000 |
0.000 0.000 | 0.000 |
0.000 0.000 | 0.012 |
0.510 0.483 | 0.528 |
0.102 0.089 | 0.111 |
0.000 0.000 | 0.000 |
||
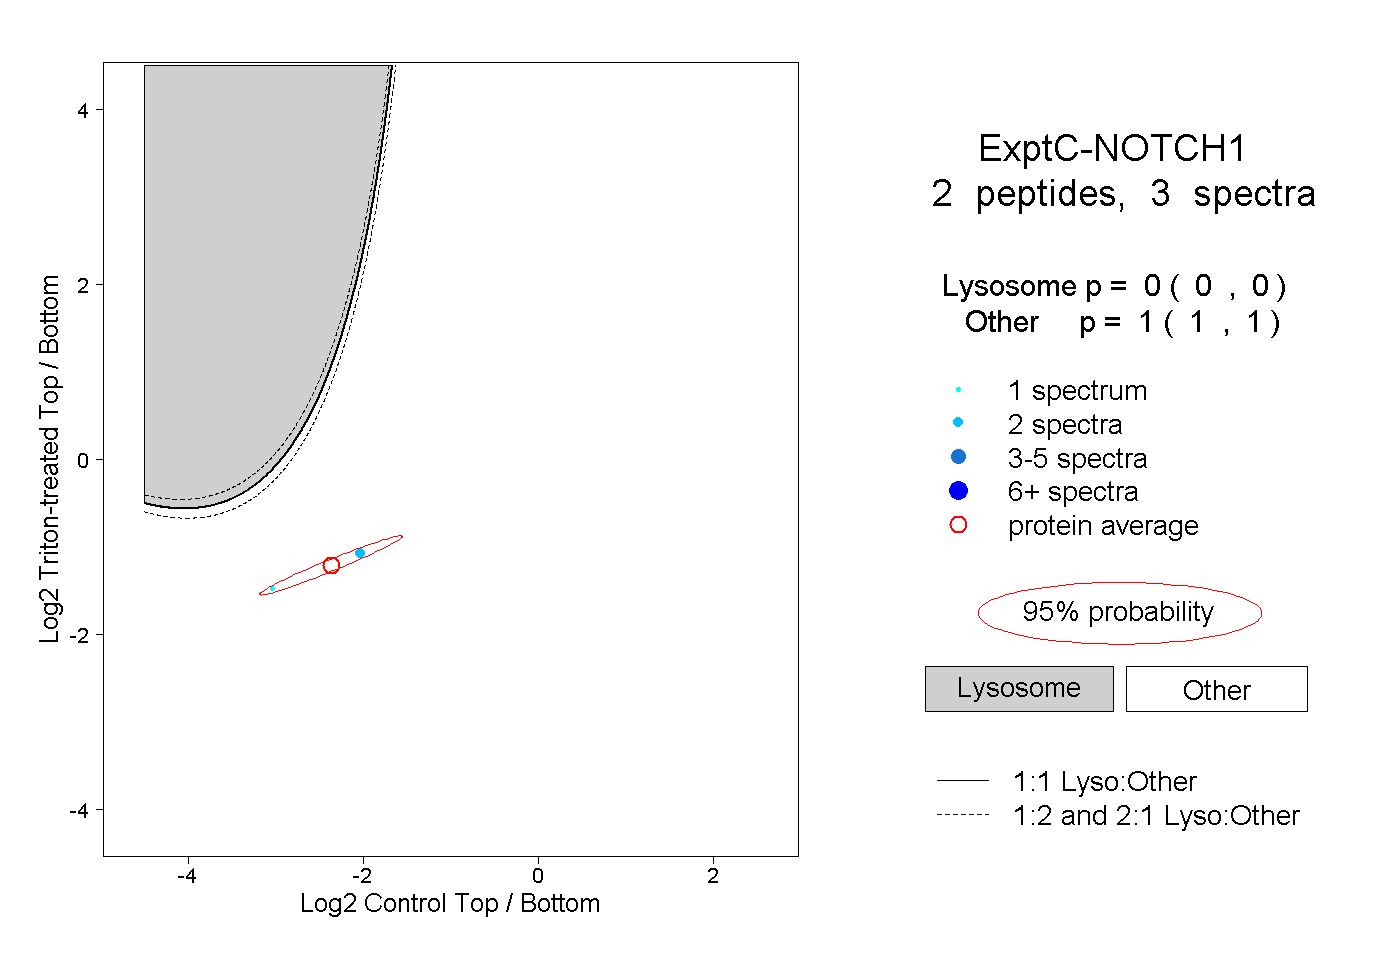
| Plot | Lyso | Other | |||||||||||
| Expt C |
2 peptides |
3 spectra |
|
0.000 0.000 | 0.000 |
1.000 1.000 | 1.000 |