 12
12peptides
spectra
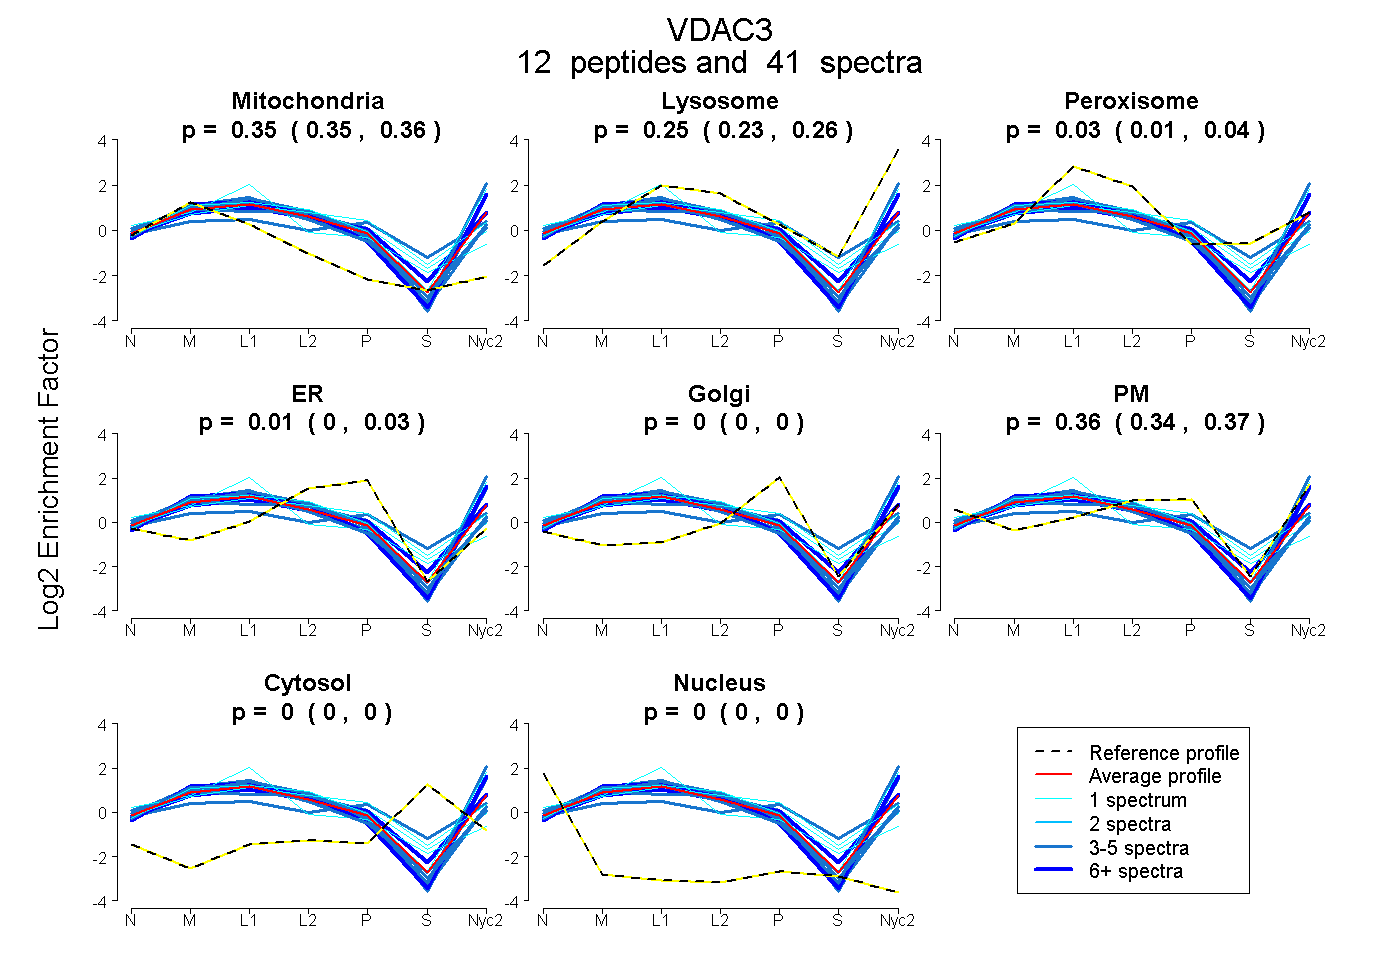
0.347 | 0.361
0.232 | 0.258
0.009 | 0.044
0.000 | 0.027
0.000 | 0.000
0.340 | 0.372
0.000 | 0.000
0.000 | 0.000
12peptides
spectra
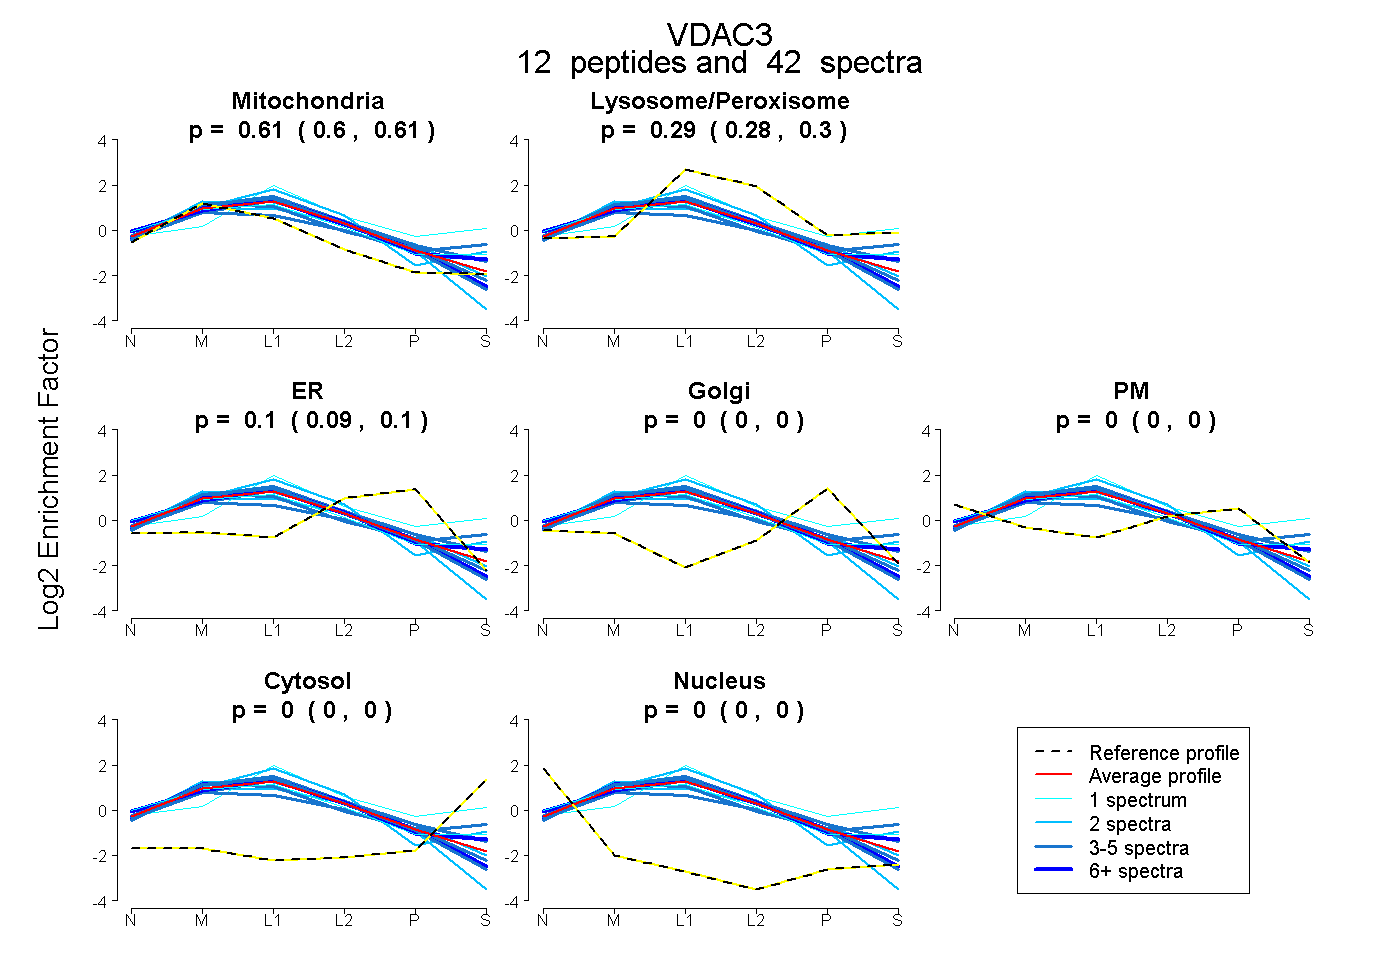
0.603 | 0.614
0.282 | 0.302
0.090 | 0.105
0.000 | 0.000
0.000 | 0.000
0.000 | 0.000
0.000 | 0.000
10peptides
spectra
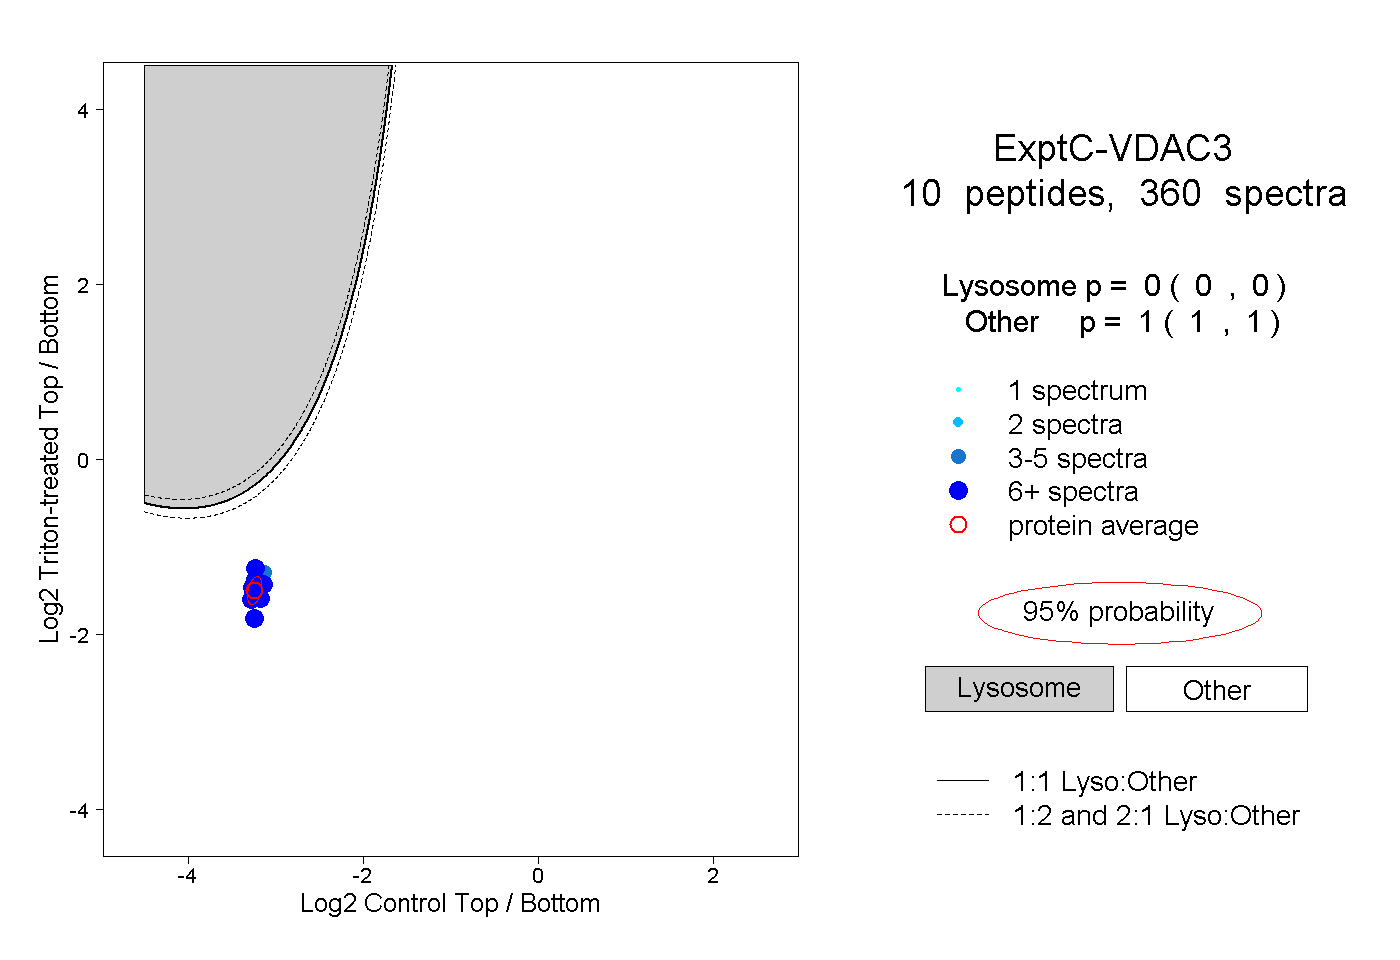
0.000 | 0.000
1.000 | 1.000
11peptides
spectra
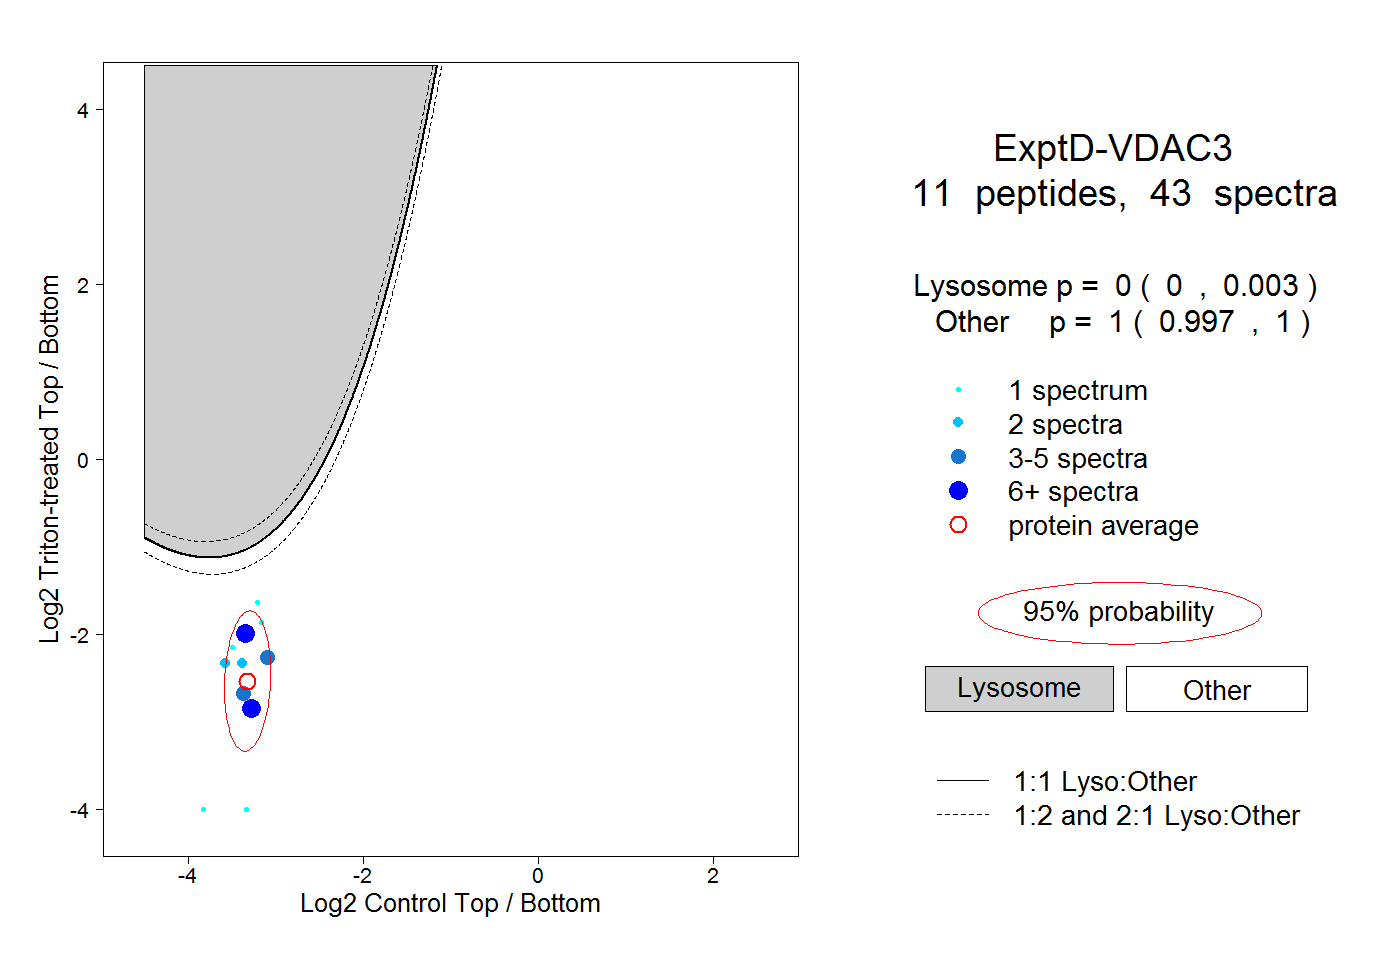
0.000 | 0.003
0.997 | 1.000