 12
12peptides
spectra
0.347 | 0.361
0.232 | 0.258
0.009 | 0.044
0.000 | 0.027
0.000 | 0.000
0.340 | 0.372
0.000 | 0.000
0.000 | 0.000
| Plot | Mito | Lyso | Perox | ER | Golgi | PM | Cytosol | Nucleus | |||||
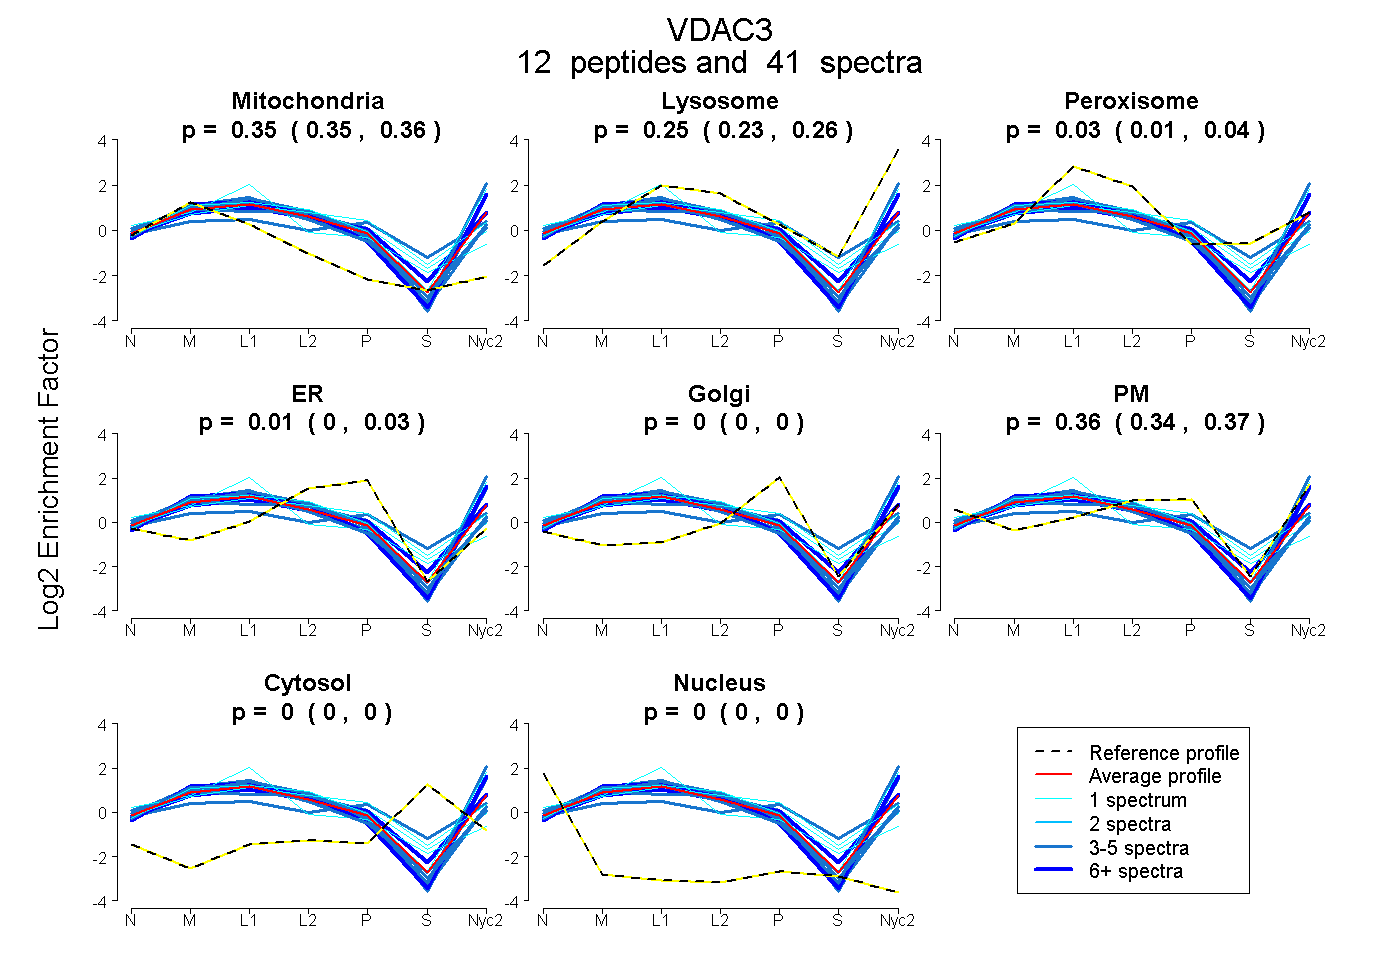
| Expt A |
12 peptides |
41 spectra |
|
0.355 0.347 | 0.361 |
0.246 0.232 | 0.258 |
0.029 0.009 | 0.044 |
0.011 0.000 | 0.027 |
0.000 0.000 | 0.000 |
0.359 0.340 | 0.372 |
0.000 0.000 | 0.000 |
0.000 0.000 | 0.000 |
| 1 spectrum, VNNASLIGLGYTQSLRPGVK | 0.242 | 0.430 | 0.000 | 0.000 | 0.000 | 0.328 | 0.000 | 0.000 | ||
| 4 spectra, VCNYGLIFTQK | 0.462 | 0.201 | 0.091 | 0.074 | 0.000 | 0.172 | 0.000 | 0.000 | ||
| 5 spectra, LAEGLK | 0.258 | 0.267 | 0.000 | 0.000 | 0.000 | 0.475 | 0.000 | 0.000 | ||
| 1 spectrum, CSTPTYCDLGK | 0.281 | 0.000 | 0.352 | 0.158 | 0.023 | 0.187 | 0.000 | 0.000 | ||
| 1 spectrum, SCSGVEFSTSGHAYTDTGK | 0.436 | 0.000 | 0.402 | 0.059 | 0.000 | 0.103 | 0.000 | 0.000 | ||
| 1 spectrum, VGLGFELEA | 0.188 | 0.031 | 0.386 | 0.078 | 0.159 | 0.157 | 0.000 | 0.000 | ||
| 6 spectra, LTLSALVDGK | 0.311 | 0.227 | 0.068 | 0.034 | 0.000 | 0.360 | 0.000 | 0.000 | ||
| 4 spectra, ASGNLETK | 0.220 | 0.074 | 0.244 | 0.000 | 0.314 | 0.079 | 0.068 | 0.000 | ||
| 4 spectra, NFNAGGHK | 0.385 | 0.190 | 0.000 | 0.191 | 0.000 | 0.233 | 0.000 | 0.000 | ||
| 4 spectra, LTVDTIFVPNTGK | 0.209 | 0.366 | 0.000 | 0.000 | 0.000 | 0.425 | 0.000 | 0.000 | ||
| 6 spectra, LCQNNFALGYK | 0.326 | 0.389 | 0.000 | 0.000 | 0.000 | 0.285 | 0.000 | 0.000 | ||
| 4 spectra, GYGFGMVK | 0.427 | 0.160 | 0.064 | 0.049 | 0.000 | 0.300 | 0.000 | 0.000 |
| Plot | Mito | Lyso or Perox | ER | Golgi | PM | Cytosol | Nucleus | ||||||
| Expt B |
12 peptides |
42 spectra |
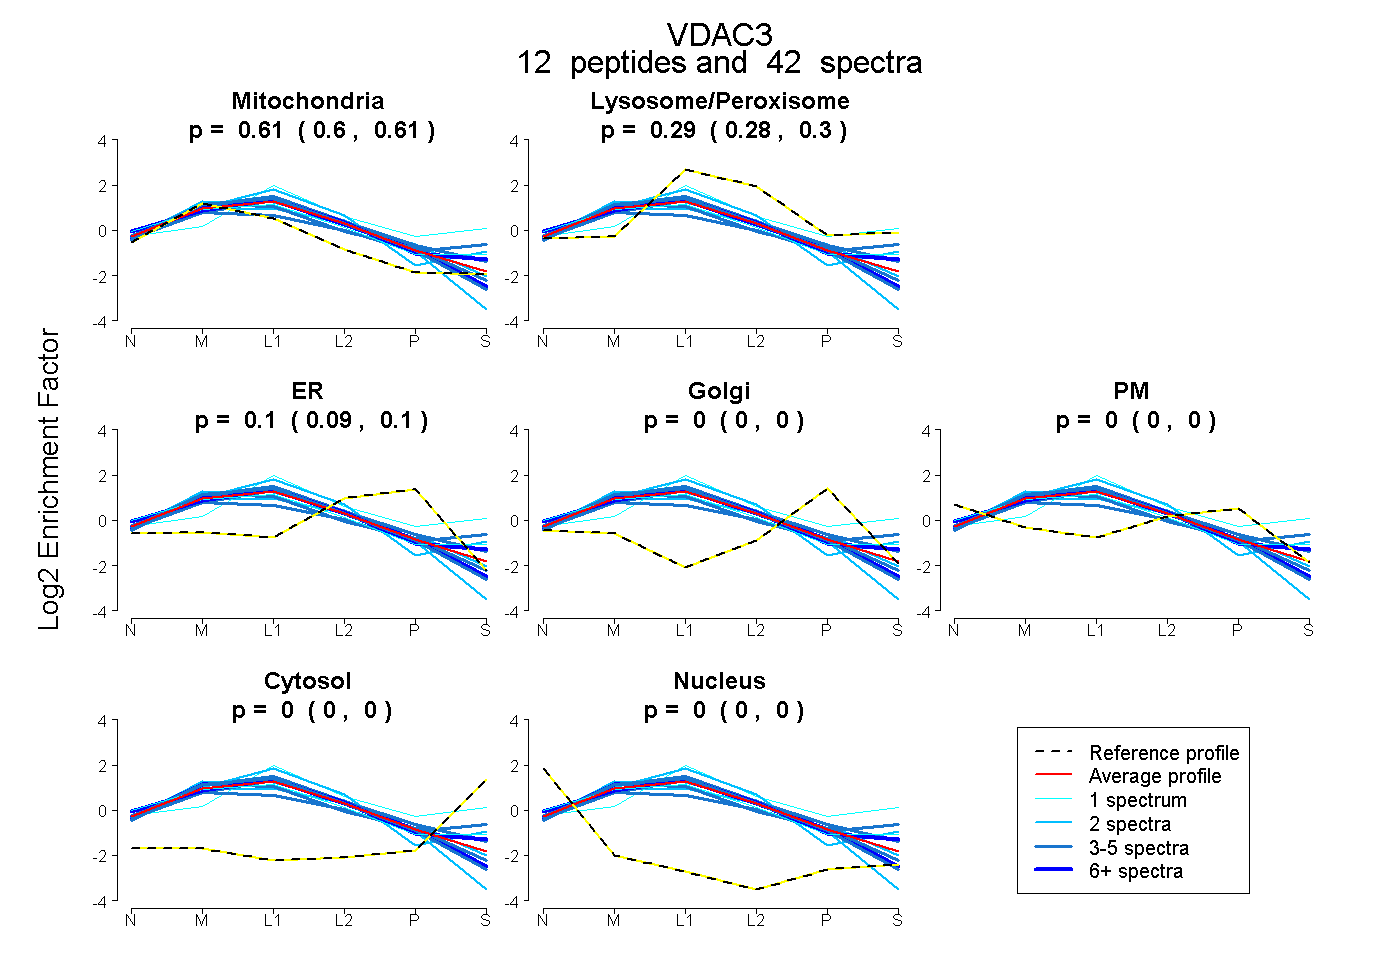 |
0.609 0.603 | 0.614 |
0.293 0.282 | 0.302 |
0.098 0.090 | 0.105 |
0.000 0.000 | 0.000 |
0.000 0.000 | 0.000 |
0.000 0.000 | 0.000 |
0.000 0.000 | 0.000 |
|||
| Plot | Lyso | Other | |||||||||||
| Expt C |
10 peptides |
360 spectra |
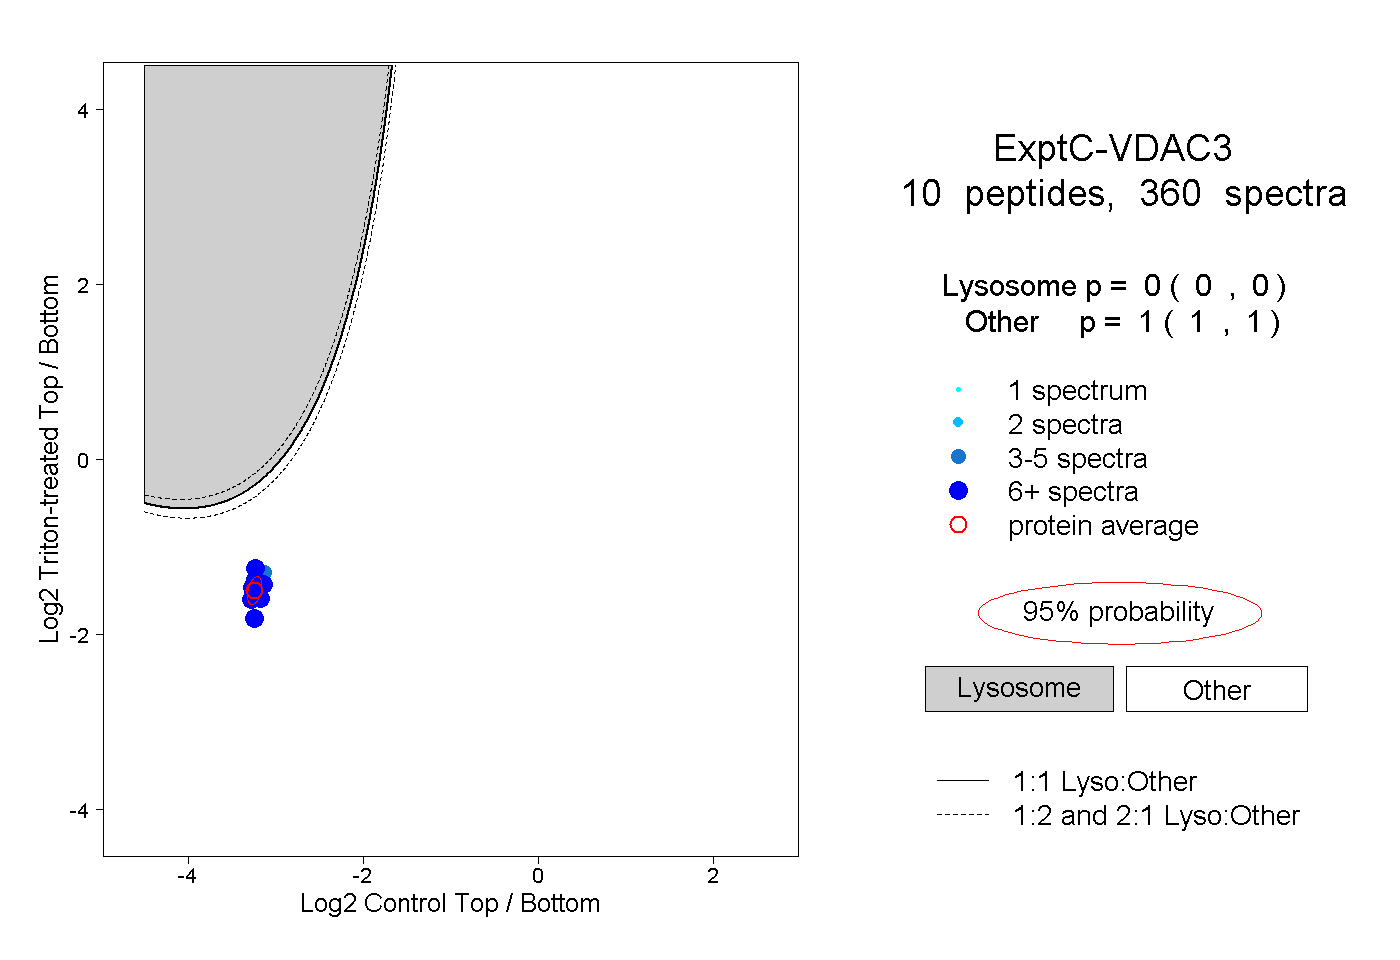 |
0.000 0.000 | 0.000 |
1.000 1.000 | 1.000 |
||||||||
| Plot | Lyso | Other | |||||||||||
| Expt D |
11 peptides |
43 spectra |
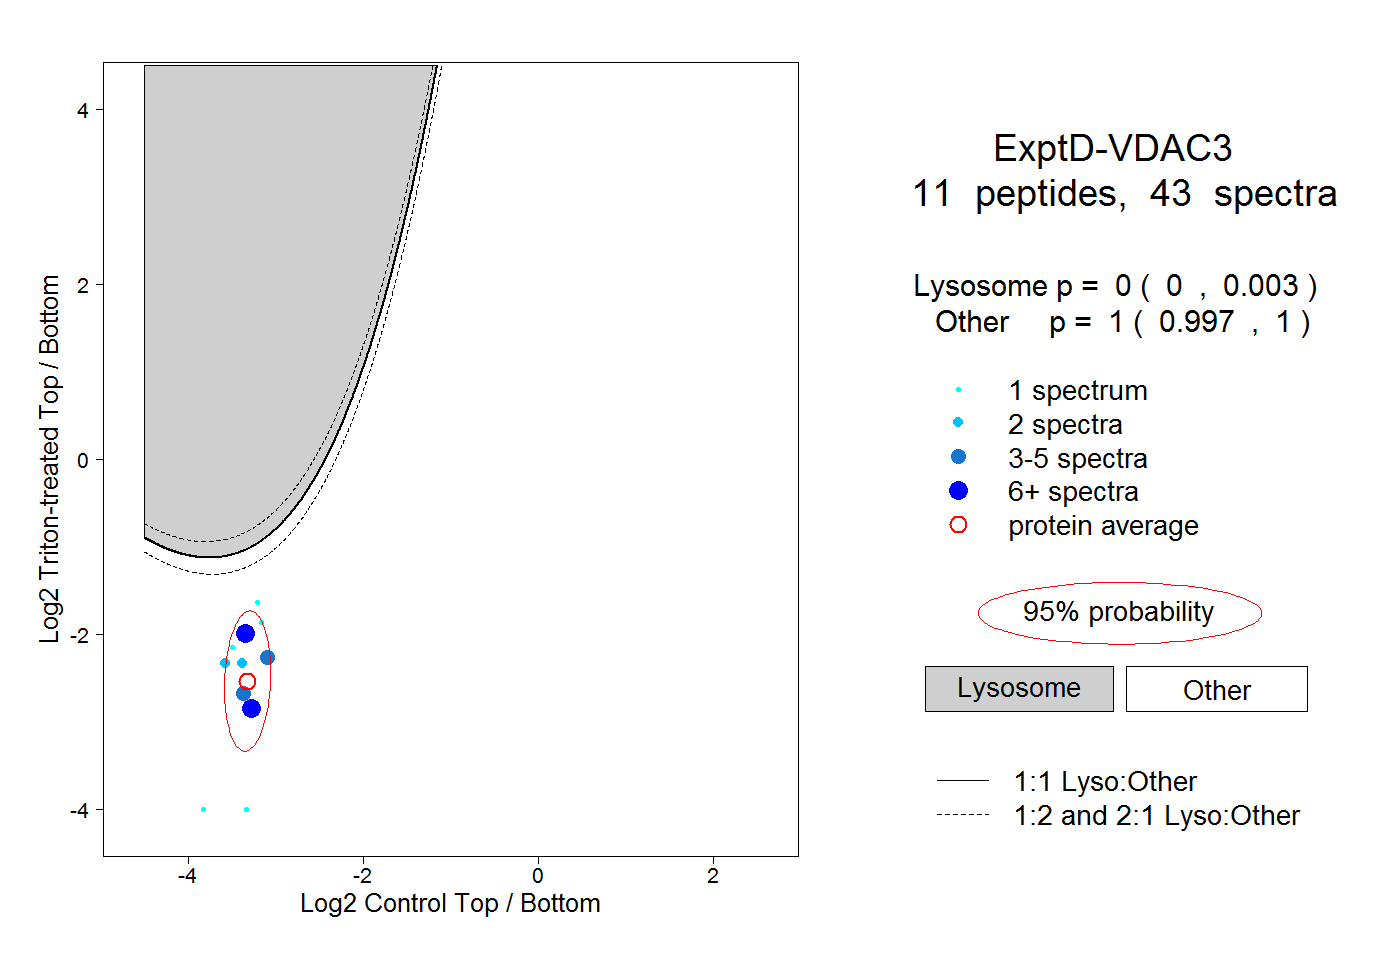 |
0.000 0.000 | 0.003 |
1.000 0.997 | 1.000 |