 3
3peptides
spectra
0.000 | 0.084
0.000 | 0.069
0.130 | 0.375
0.000 | 0.000
0.000 | 0.363
0.064 | 0.456
0.140 | 0.314
0.000 | 0.000
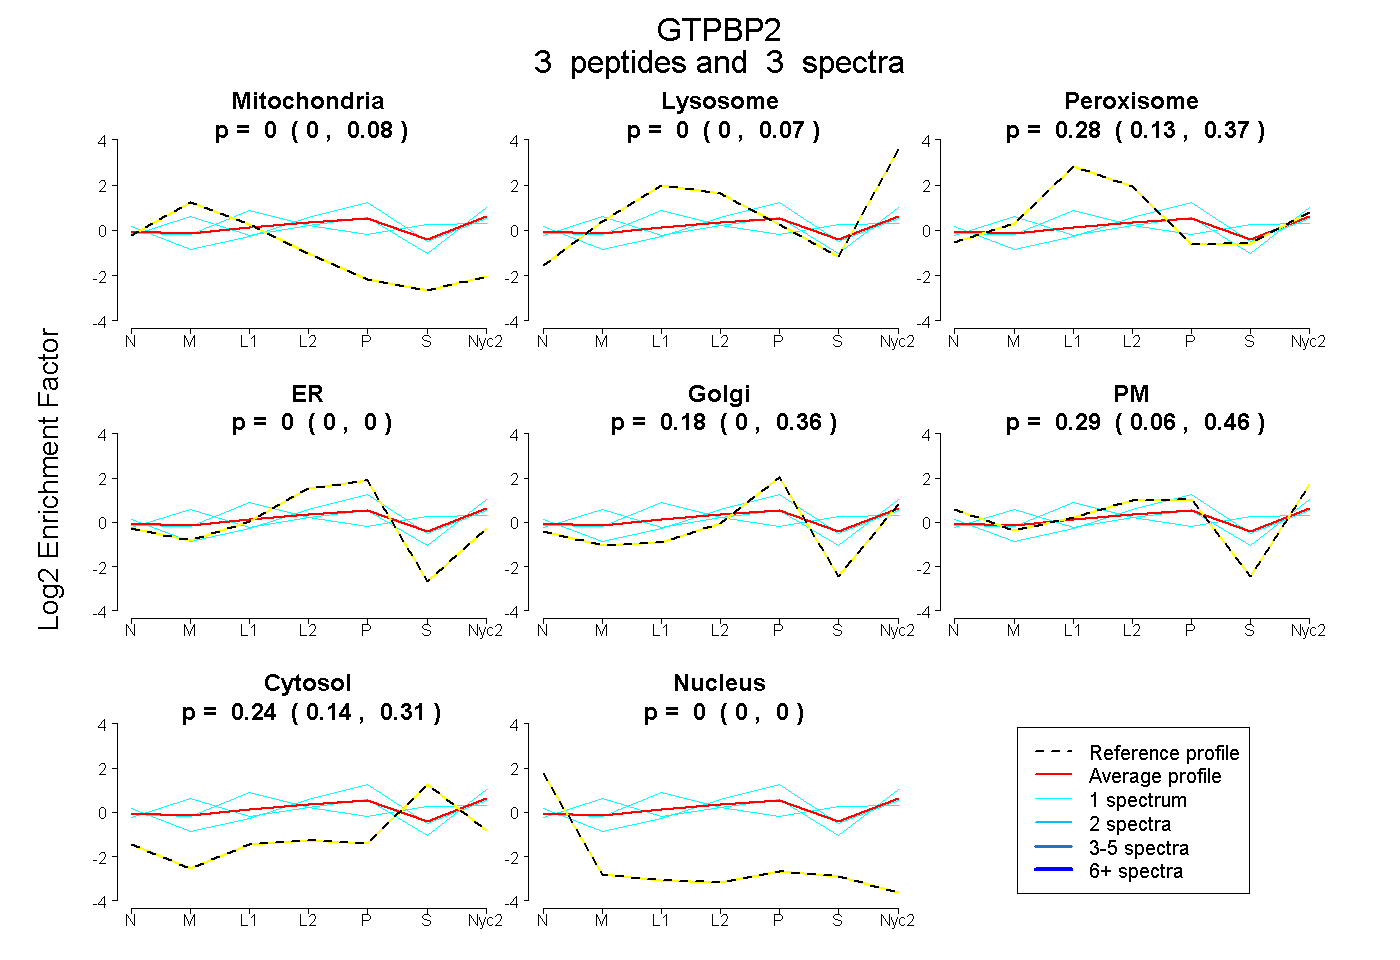
| Plot | Mito | Lyso | Perox | ER | Golgi | PM | Cytosol | Nucleus | |||||
| Expt A |
3 peptides |
3 spectra |
|
0.003 0.000 | 0.084 |
0.000 0.000 | 0.069 |
0.279 0.130 | 0.375 |
0.000 0.000 | 0.000 |
0.184 0.000 | 0.363 |
0.292 0.064 | 0.456 |
0.242 0.140 | 0.314 |
0.000 0.000 | 0.000 |
| 1 spectrum, VFLNILPPLTNSK | 0.000 | 0.000 | 0.102 | 0.142 | 0.183 | 0.322 | 0.251 | 0.000 | ||
| 1 spectrum, VPFFIVVSK | 0.177 | 0.243 | 0.000 | 0.000 | 0.214 | 0.248 | 0.119 | 0.000 | ||
| 1 spectrum, GAGGSSSCGGPK | 0.023 | 0.000 | 0.464 | 0.000 | 0.000 | 0.180 | 0.333 | 0.000 |
| Plot | Lyso | Other | |||||||||||
| Expt D |
1 peptide |
2 spectra |
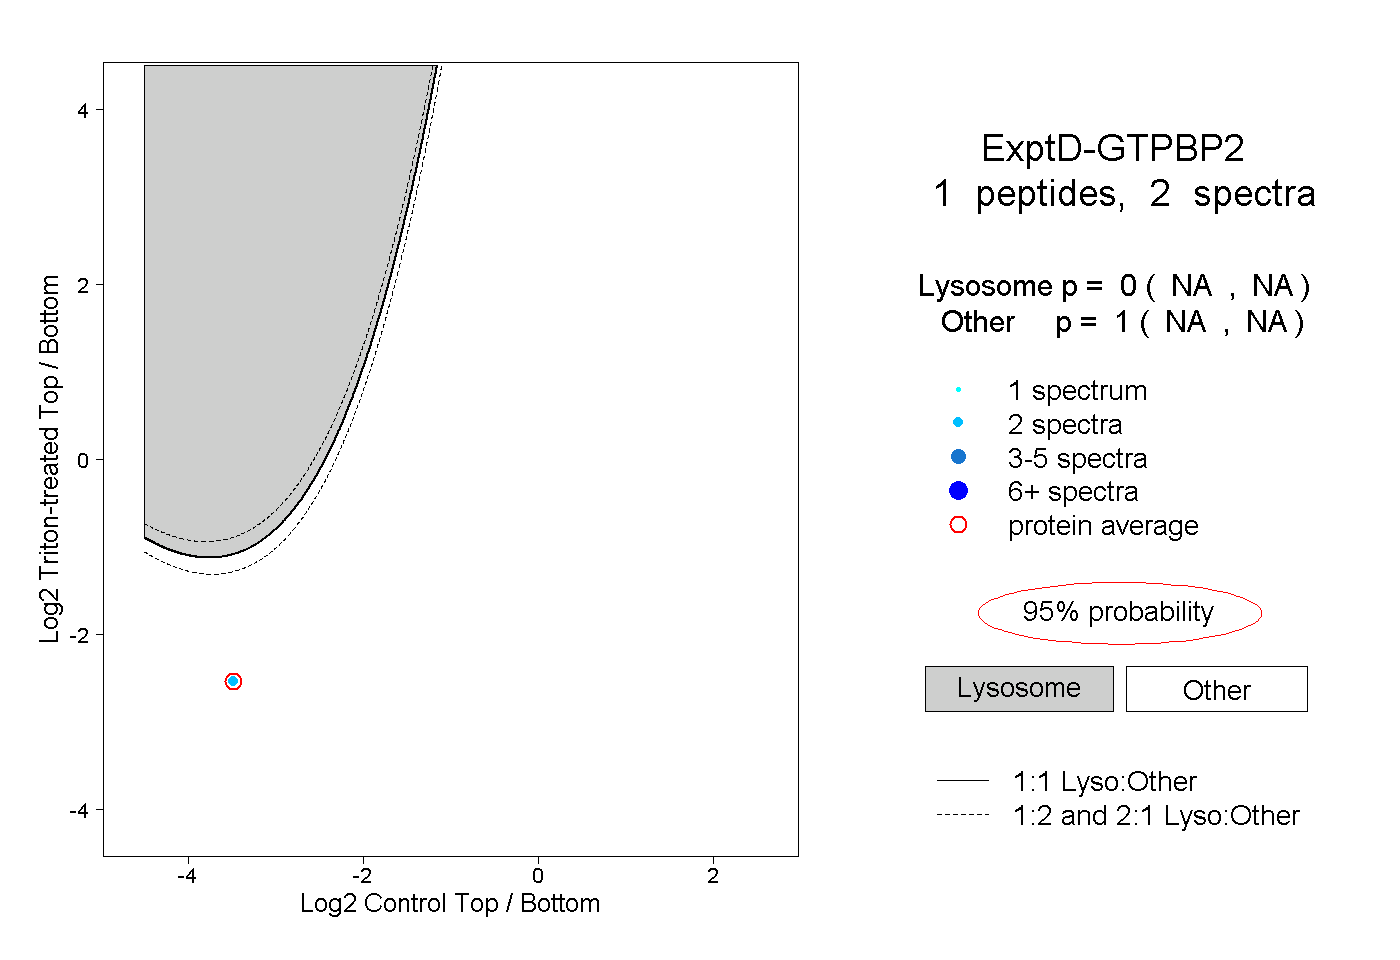 |
0.000 NA | NA |
1.000 NA | NA |