 6
6peptides
spectra
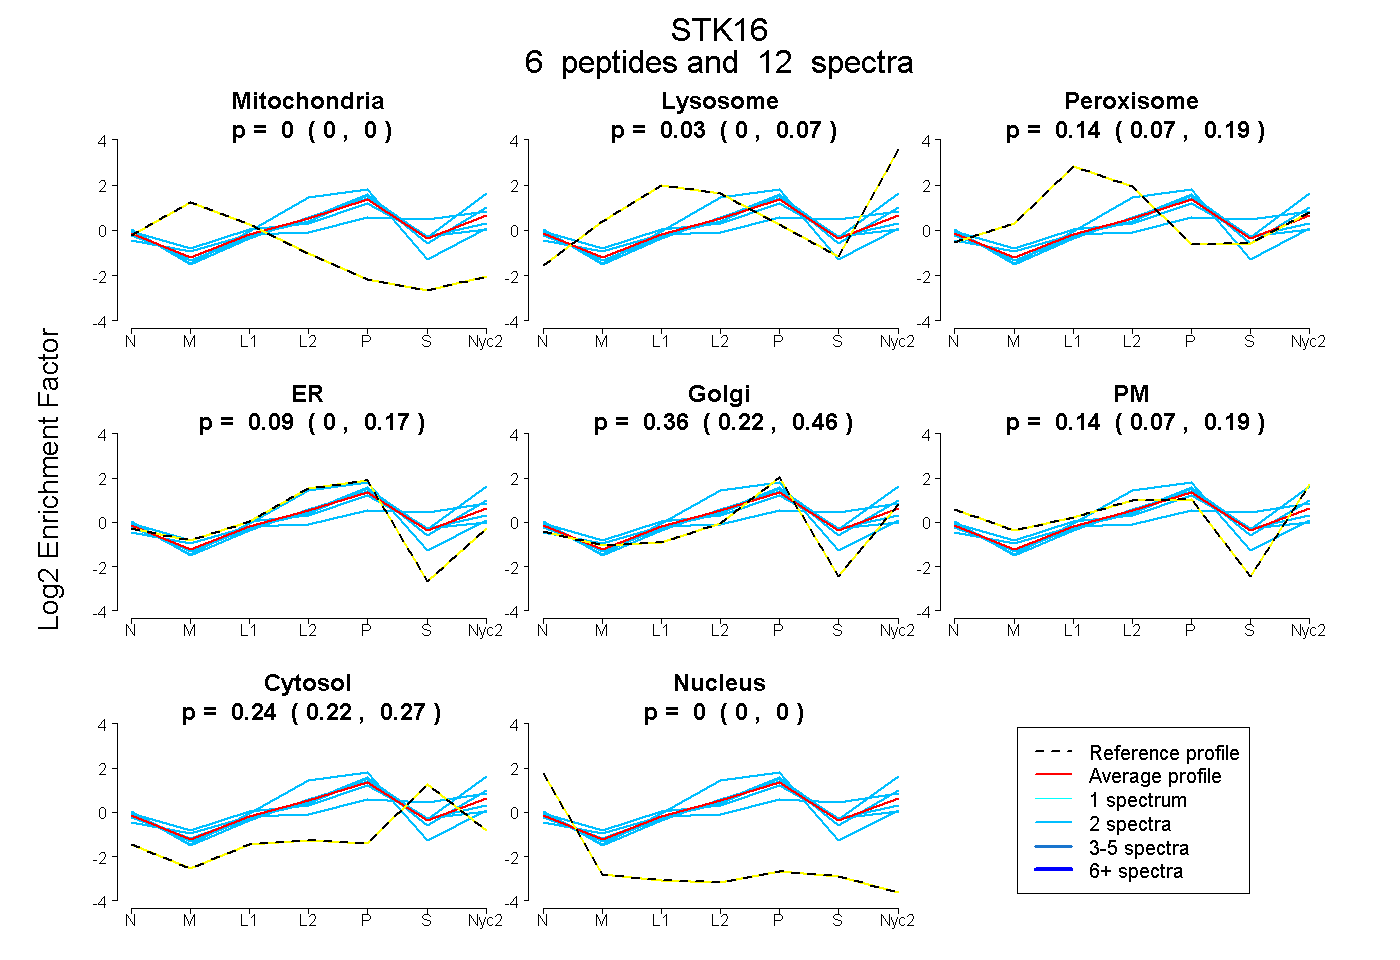
0.000 | 0.000
0.000 | 0.072
0.068 | 0.190
0.000 | 0.173
0.216 | 0.464
0.069 | 0.195
0.217 | 0.267
0.000 | 0.000
2peptides
spectra
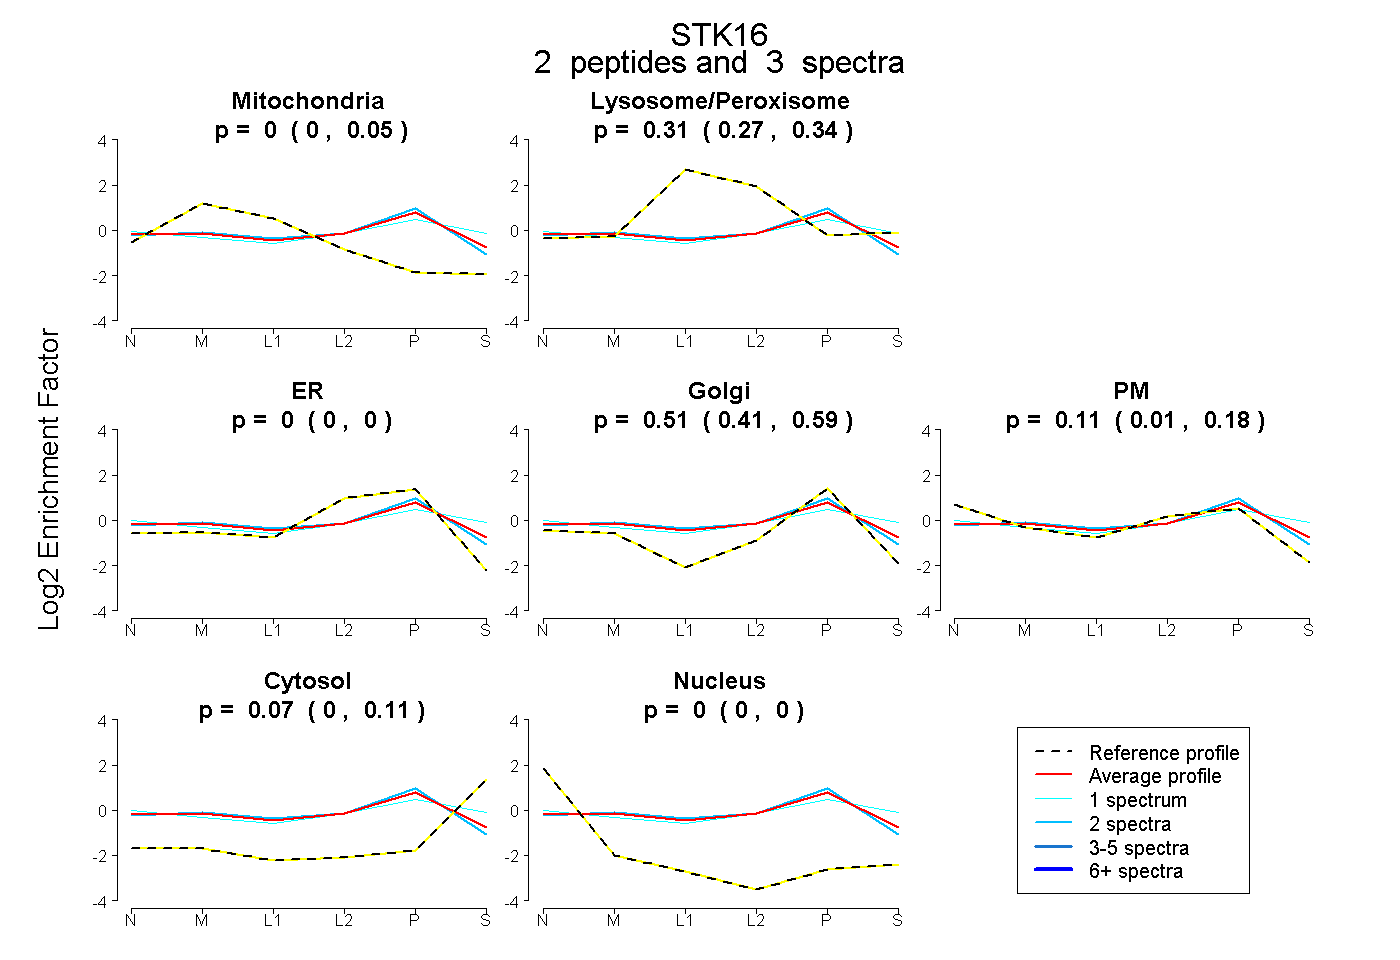
0.000 | 0.053
0.266 | 0.343
0.000 | 0.000
0.407 | 0.588
0.011 | 0.177
0.003 | 0.113
0.000 | 0.000
5peptides
spectra
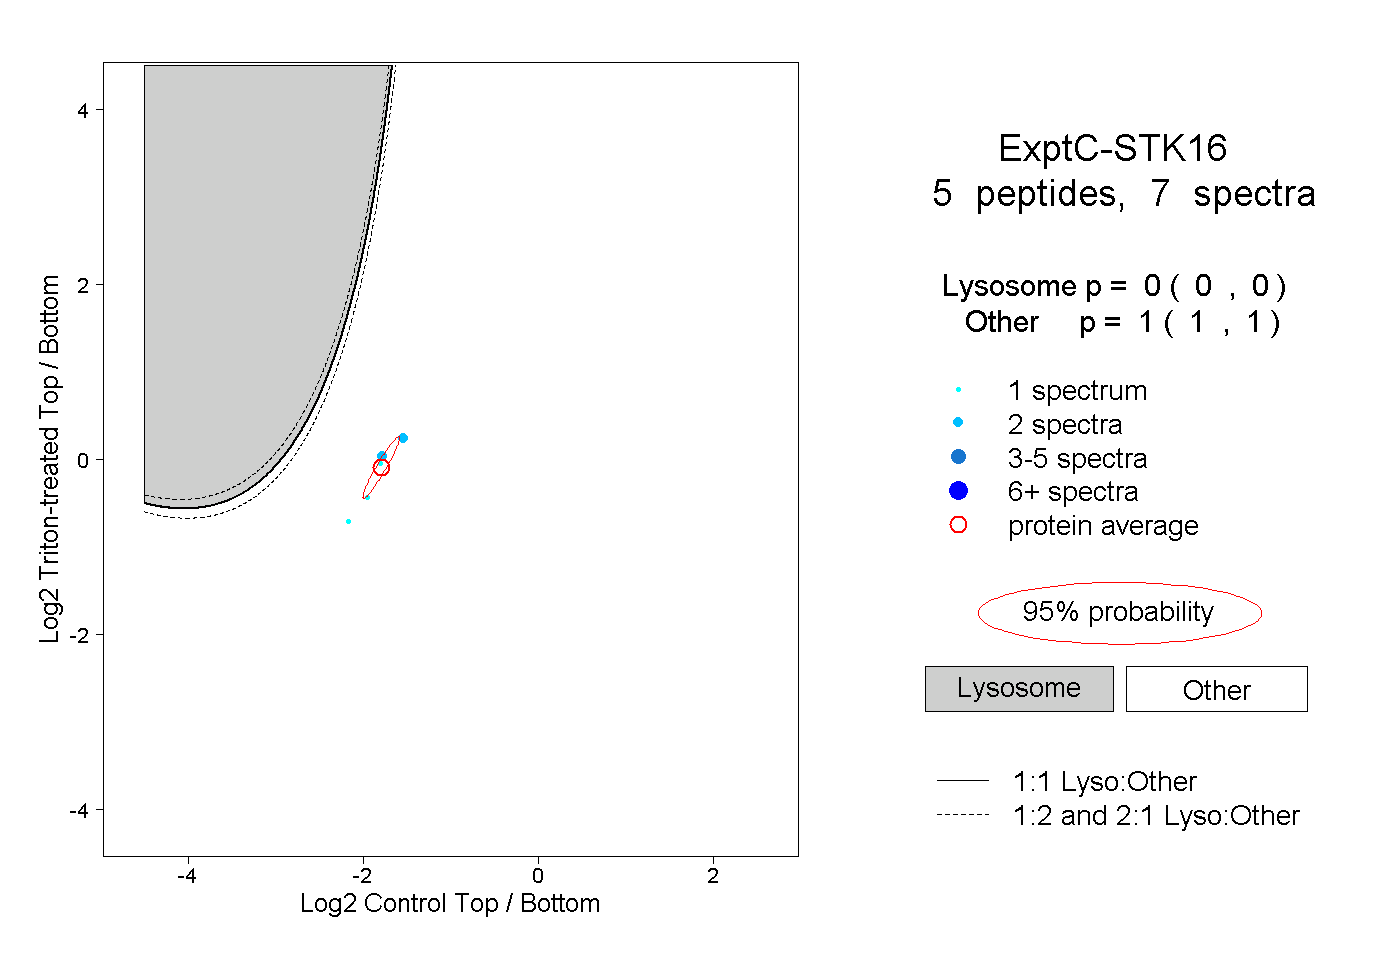
0.000 | 0.000
1.000 | 1.000