 4
4peptides
spectra
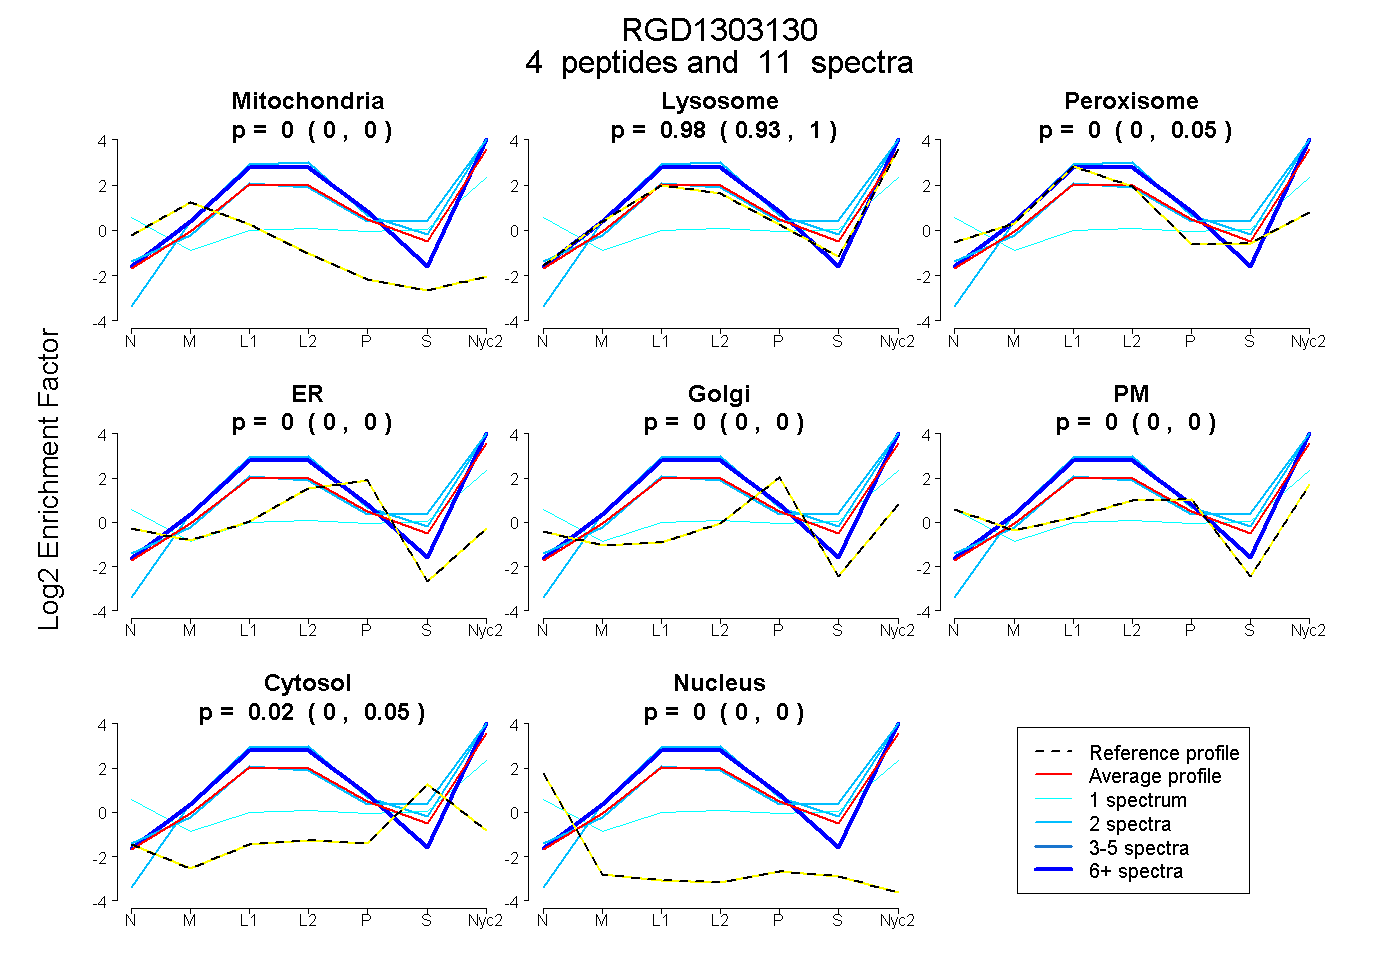
0.000 | 0.000
0.927 | 0.996
0.000 | 0.053
0.000 | 0.000
0.000 | 0.000
0.000 | 0.000
0.000 | 0.054
0.000 | 0.000
1peptide
spectra
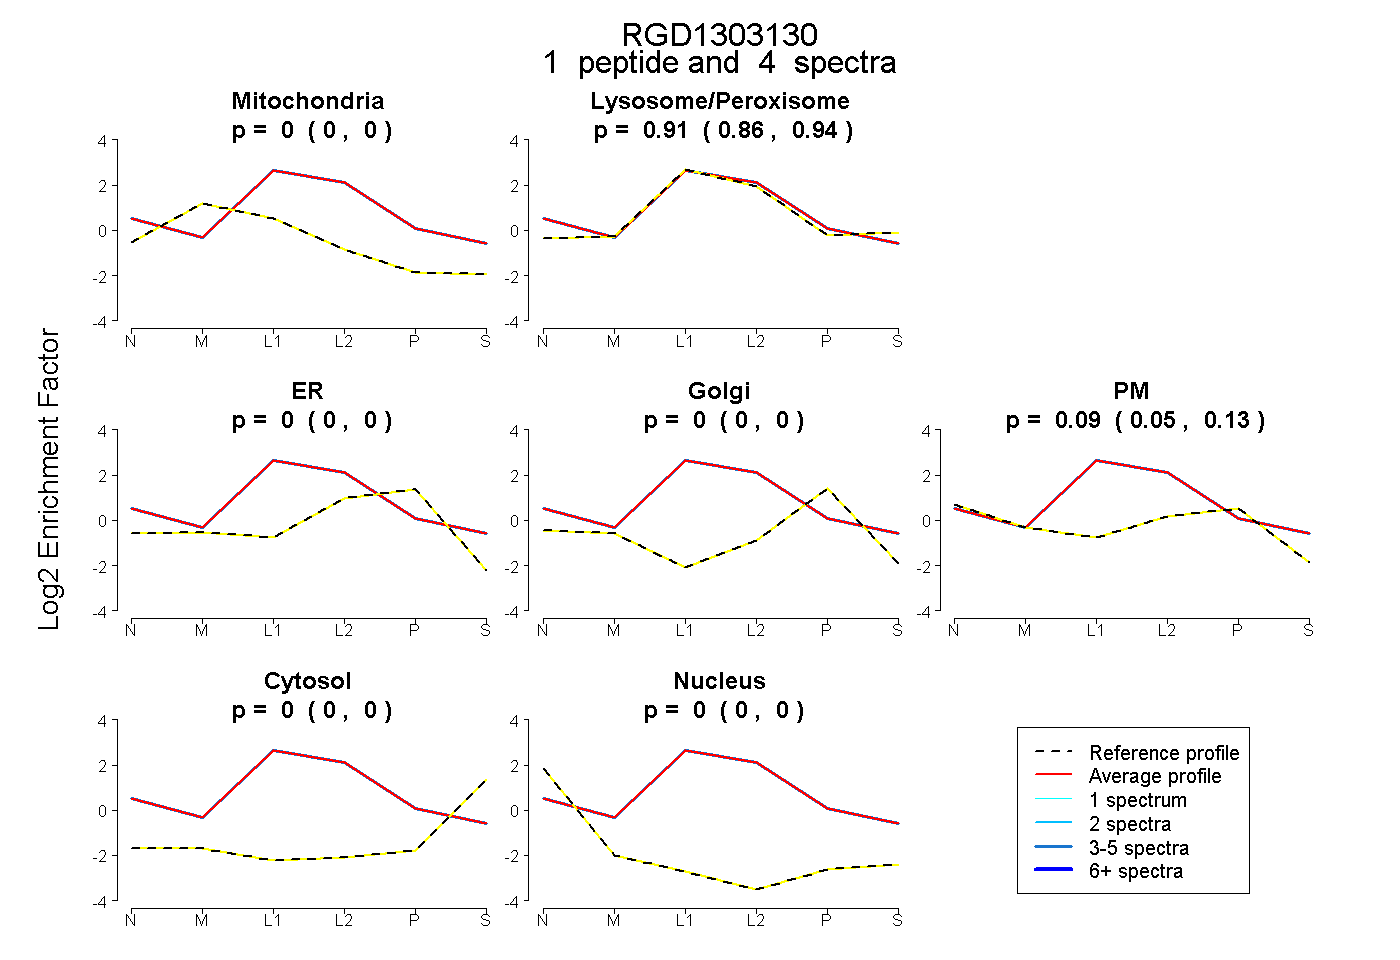
0.000 | 0.000
0.865 | 0.942
0.000 | 0.000
0.000 | 0.000
0.050 | 0.127
0.000 | 0.000
0.000 | 0.000
4peptides
spectra
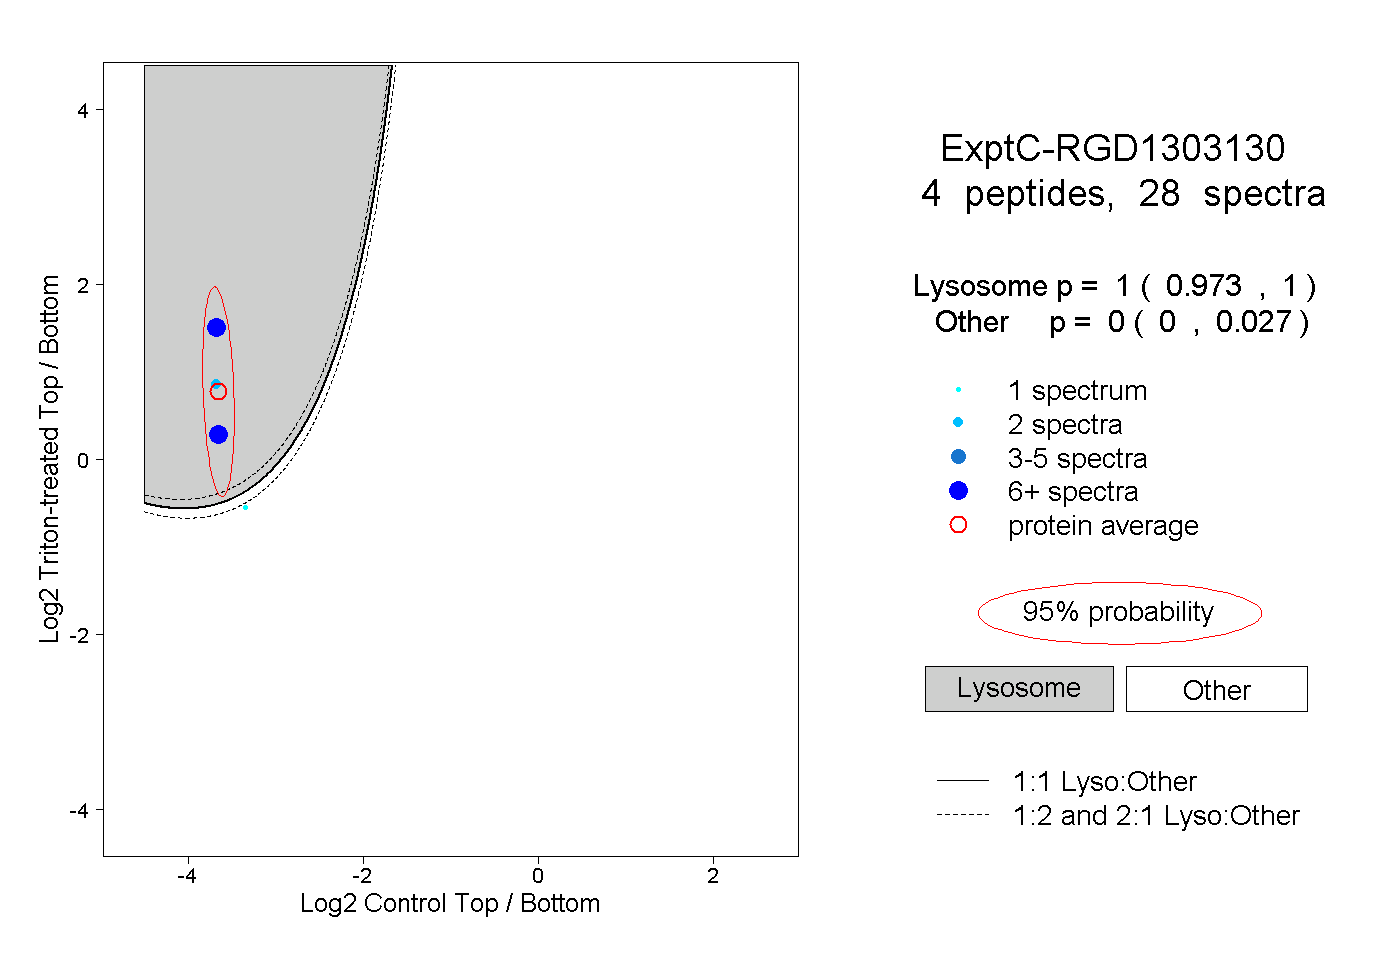
0.973 | 1.000
0.000 | 0.027