 1
1peptide
spectra
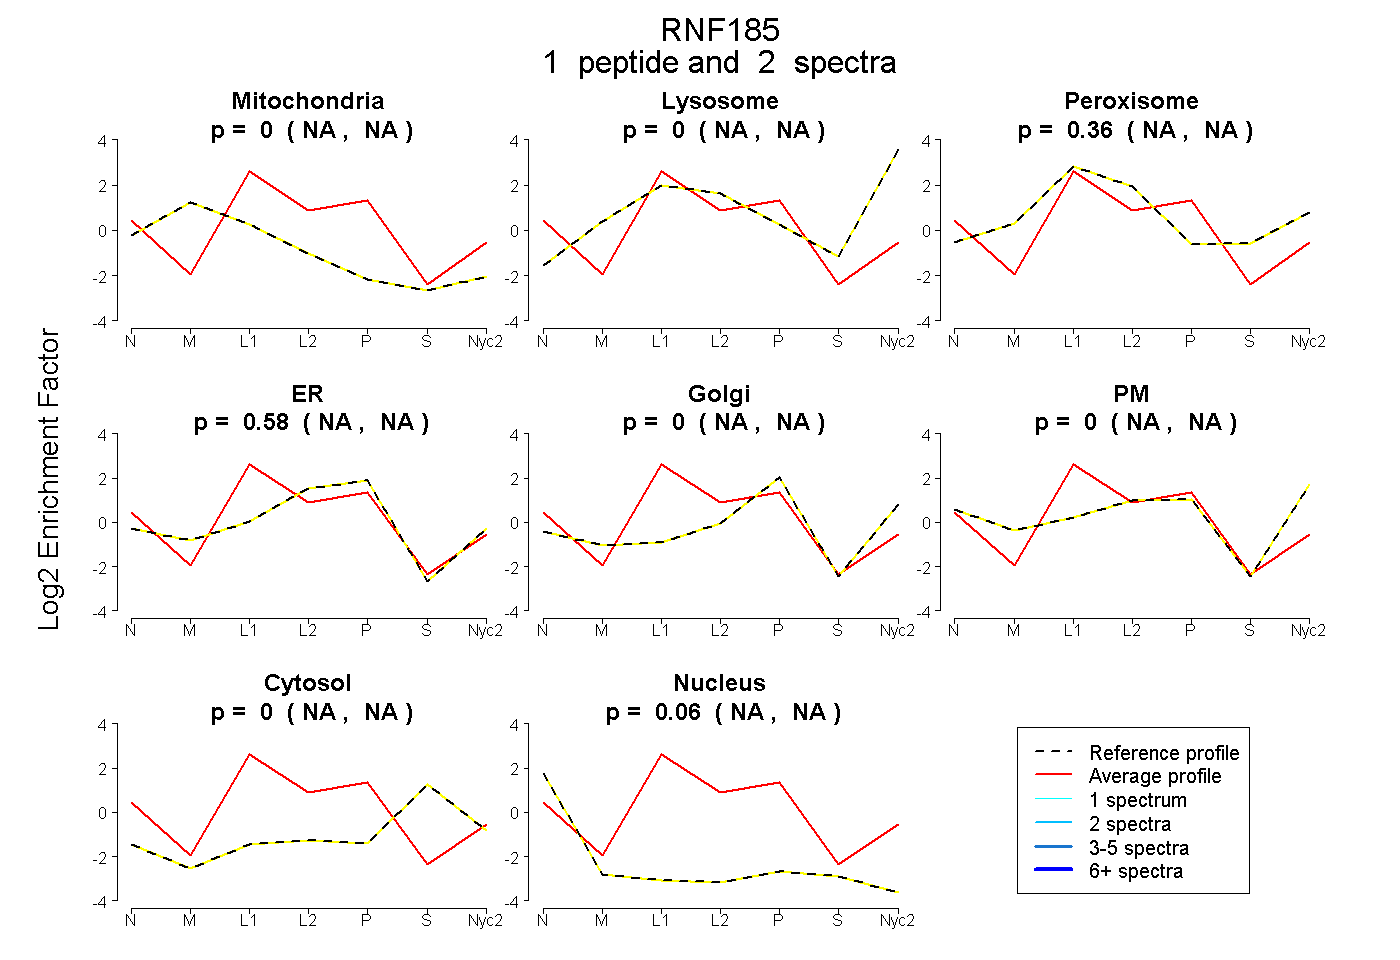
NA | NA
NA | NA
NA | NA
NA | NA
NA | NA
NA | NA
NA | NA
NA | NA
2peptides
spectra
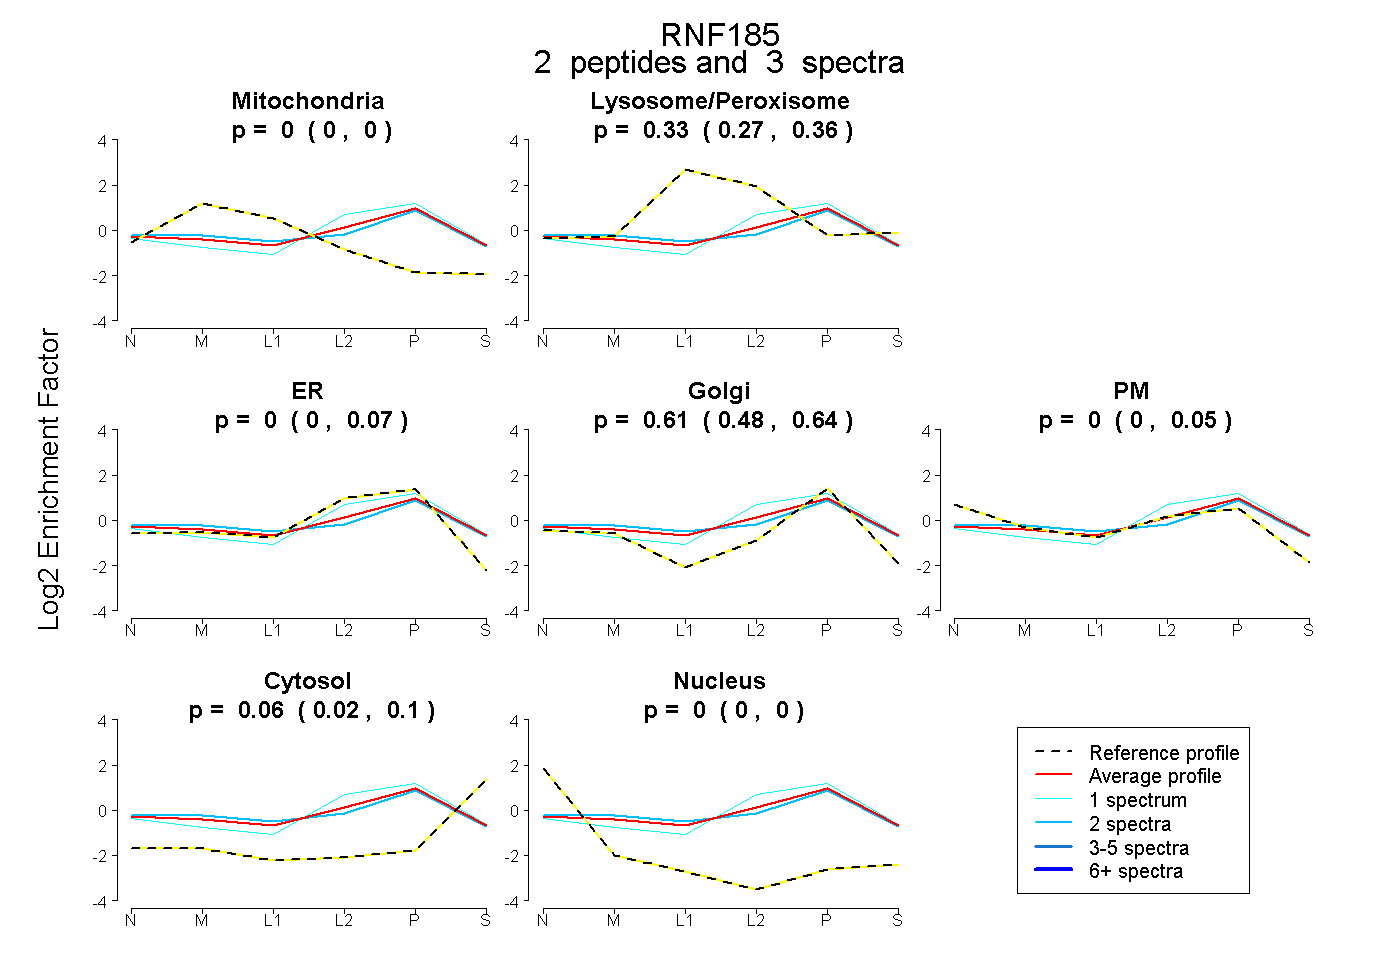
0.000 | 0.000
0.268 | 0.363
0.000 | 0.074
0.483 | 0.645
0.000 | 0.047
0.016 | 0.097
0.000 | 0.000
2peptides
spectra
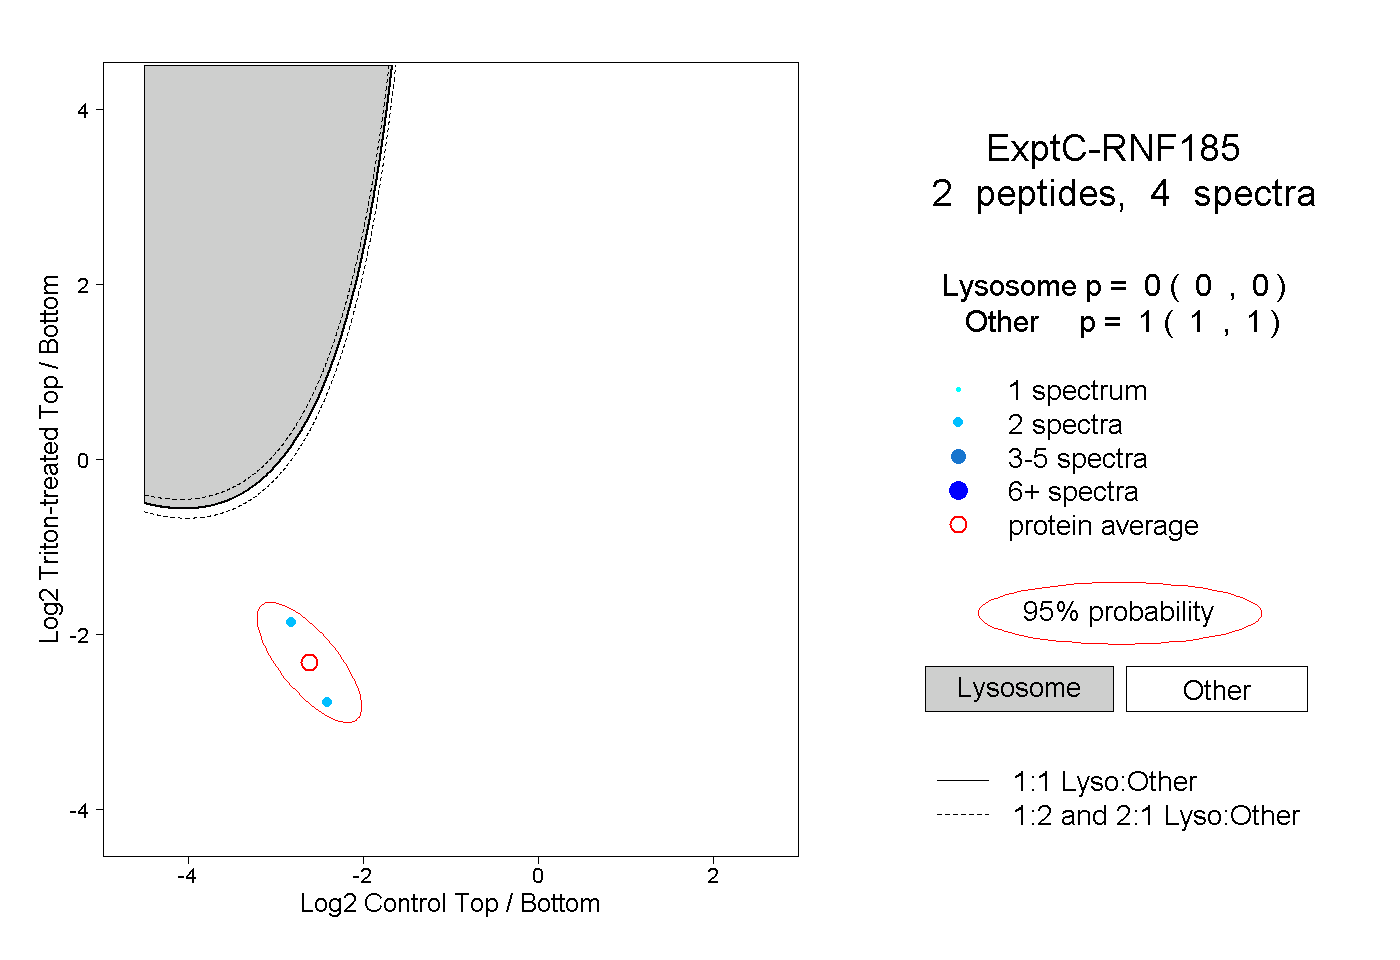
0.000 | 0.000
1.000 | 1.000