 2
2peptides
spectra
0.000 | 0.000
0.000 | 0.000
0.000 | 0.018
0.070 | 0.158
0.000 | 0.000
0.780 | 0.844
0.000 | 0.094
0.000 | 0.029
4peptides
spectra
0.000 | 0.000
1.000 | 1.000
| Plot | Mito | Lyso | Perox | ER | Golgi | PM | Cytosol | Nucleus | |||||
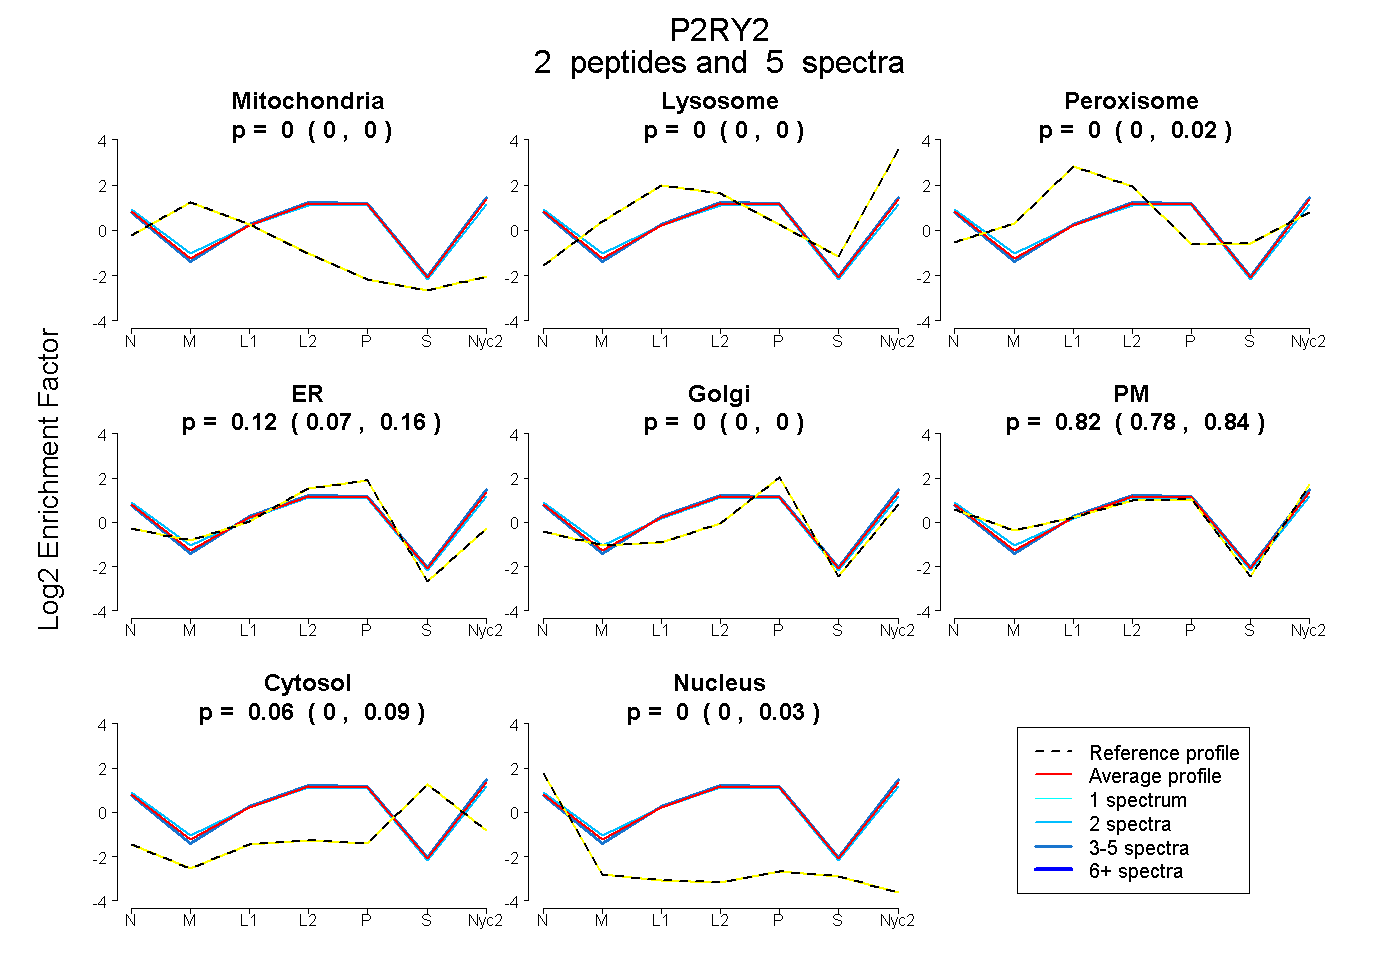
| Expt A |
2 peptides |
5 spectra |
|
0.000 0.000 | 0.000 |
0.000 0.000 | 0.000 |
0.000 0.000 | 0.018 |
0.125 0.070 | 0.158 |
0.000 0.000 | 0.000 |
0.817 0.780 | 0.844 |
0.059 0.000 | 0.094 |
0.000 0.000 | 0.029 |
||
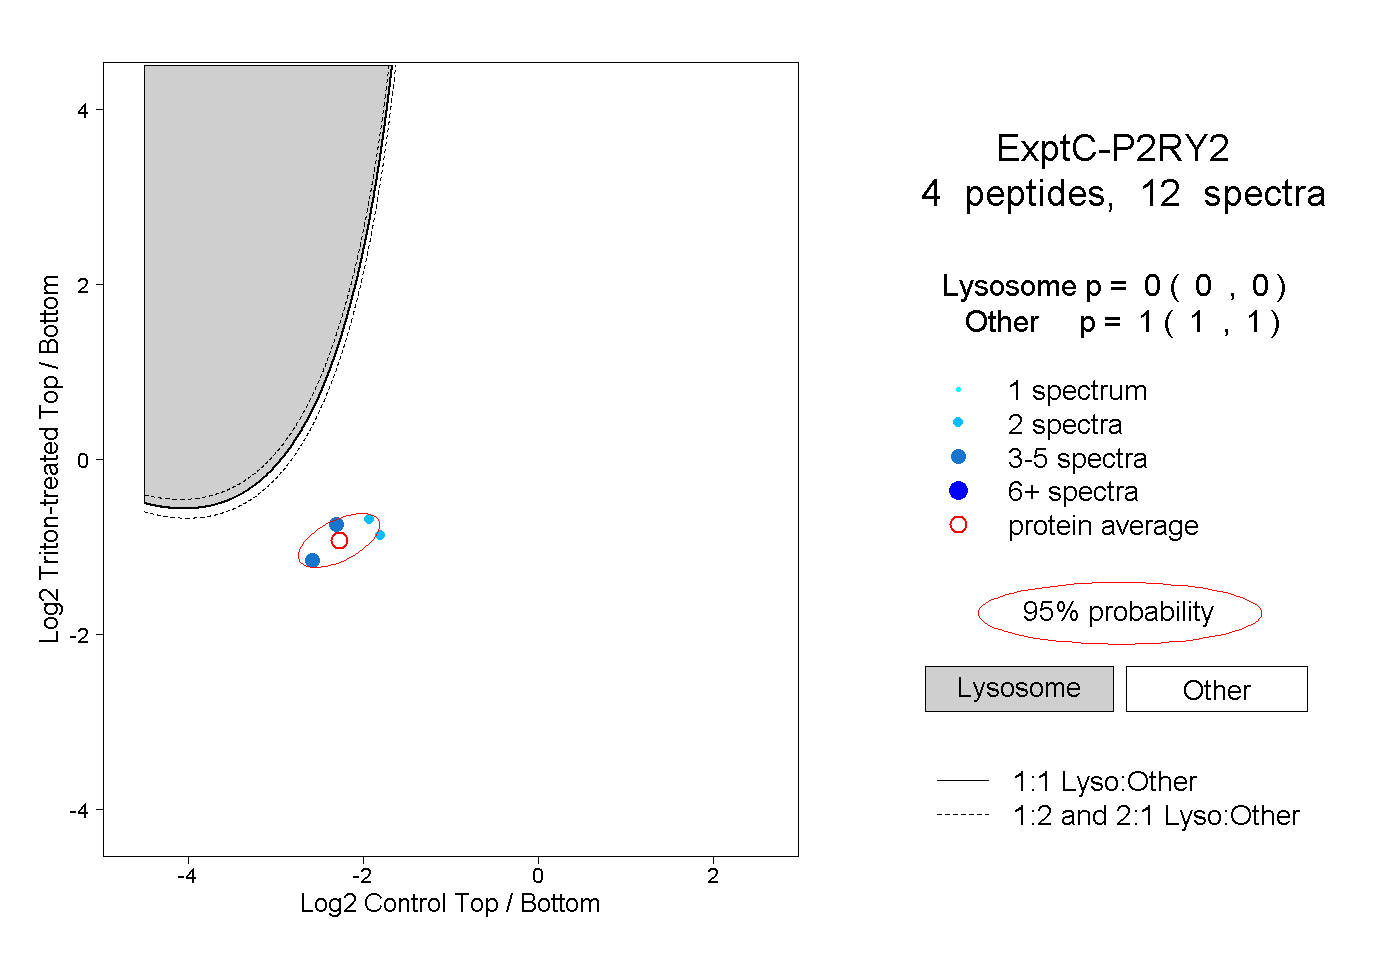
| Plot | Lyso | Other | |||||||||||
| Expt C |
4 peptides |
12 spectra |
|
0.000 0.000 | 0.000 |
1.000 1.000 | 1.000 |