 7
7peptides
spectra
0.000 | 0.000
0.000 | 0.000
0.000 | 0.000
0.210 | 0.336
0.000 | 0.102
0.000 | 0.000
0.275 | 0.304
0.359 | 0.401
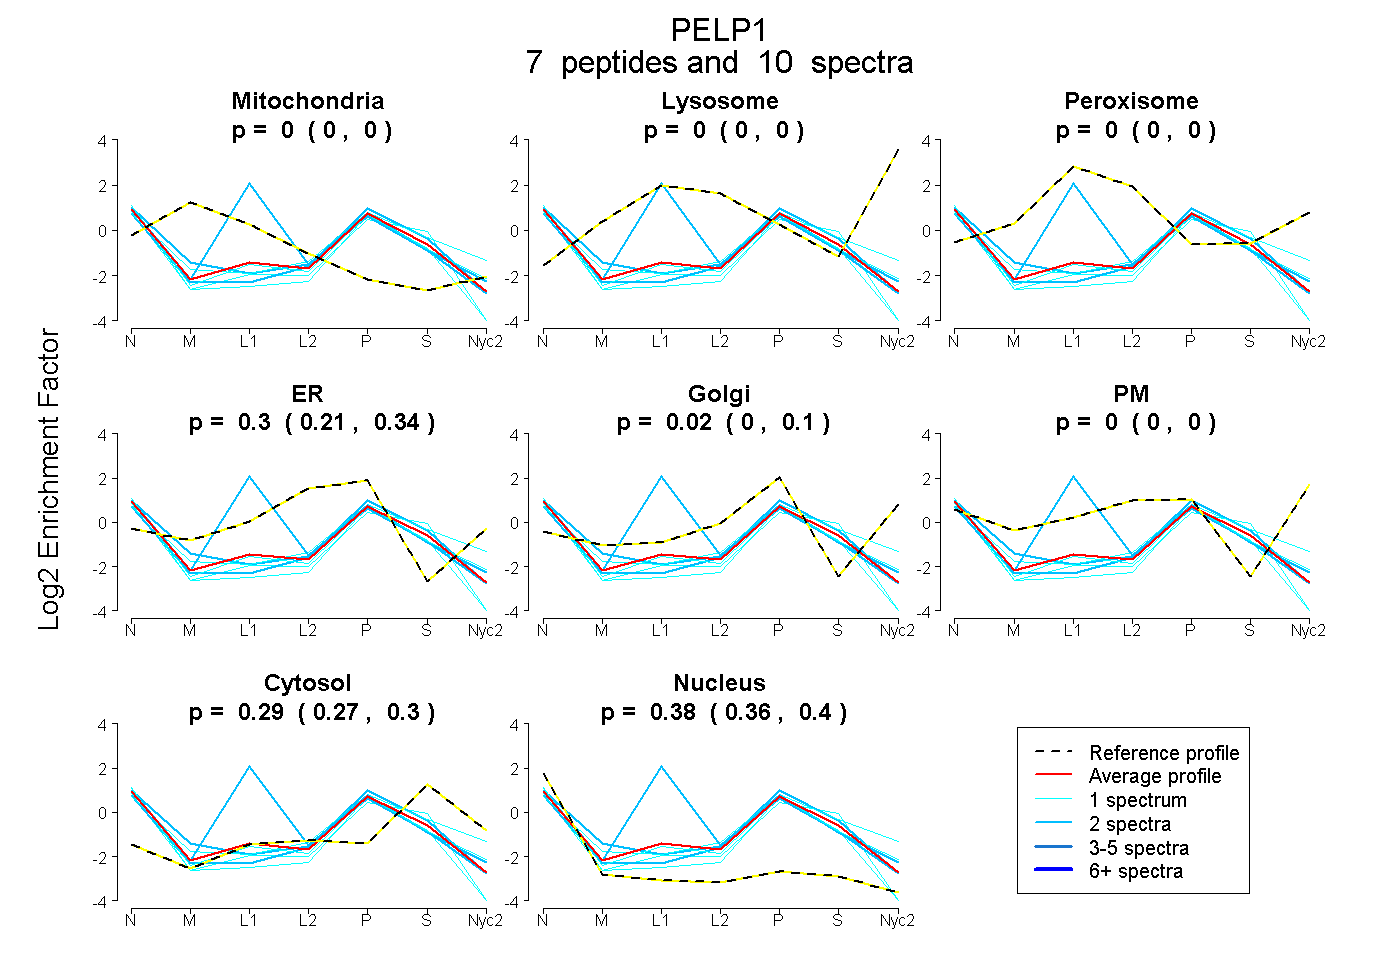
| Plot | Mito | Lyso | Perox | ER | Golgi | PM | Cytosol | Nucleus | |||||
| Expt A |
7 peptides |
10 spectra |
|
0.000 0.000 | 0.000 |
0.000 0.000 | 0.000 |
0.000 0.000 | 0.000 |
0.304 0.210 | 0.336 |
0.021 0.000 | 0.102 |
0.000 0.000 | 0.000 |
0.293 0.275 | 0.304 |
0.382 0.359 | 0.401 |
| 1 spectrum, LLPQVLNTWSTGR | 0.000 | 0.000 | 0.000 | 0.198 | 0.000 | 0.000 | 0.215 | 0.587 | ||
| 2 spectra, DALAPGQERPYSTIR | 0.000 | 0.000 | 0.000 | 0.146 | 0.163 | 0.000 | 0.315 | 0.376 | ||
| 1 spectrum, YASQLPTLFR | 0.000 | 0.000 | 0.000 | 0.081 | 0.296 | 0.000 | 0.239 | 0.385 | ||
| 2 spectra, NINLLGDGPLR | 0.000 | 0.000 | 0.413 | 0.181 | 0.000 | 0.000 | 0.058 | 0.348 | ||
| 2 spectra, FSGLAR | 0.000 | 0.000 | 0.000 | 0.311 | 0.054 | 0.000 | 0.211 | 0.424 | ||
| 1 spectrum, ACVTYFPR | 0.000 | 0.000 | 0.000 | 0.155 | 0.000 | 0.000 | 0.370 | 0.475 | ||
| 1 spectrum, NANSDVCAAALR | 0.000 | 0.000 | 0.000 | 0.000 | 0.427 | 0.000 | 0.334 | 0.238 |