 3
3peptides
spectra
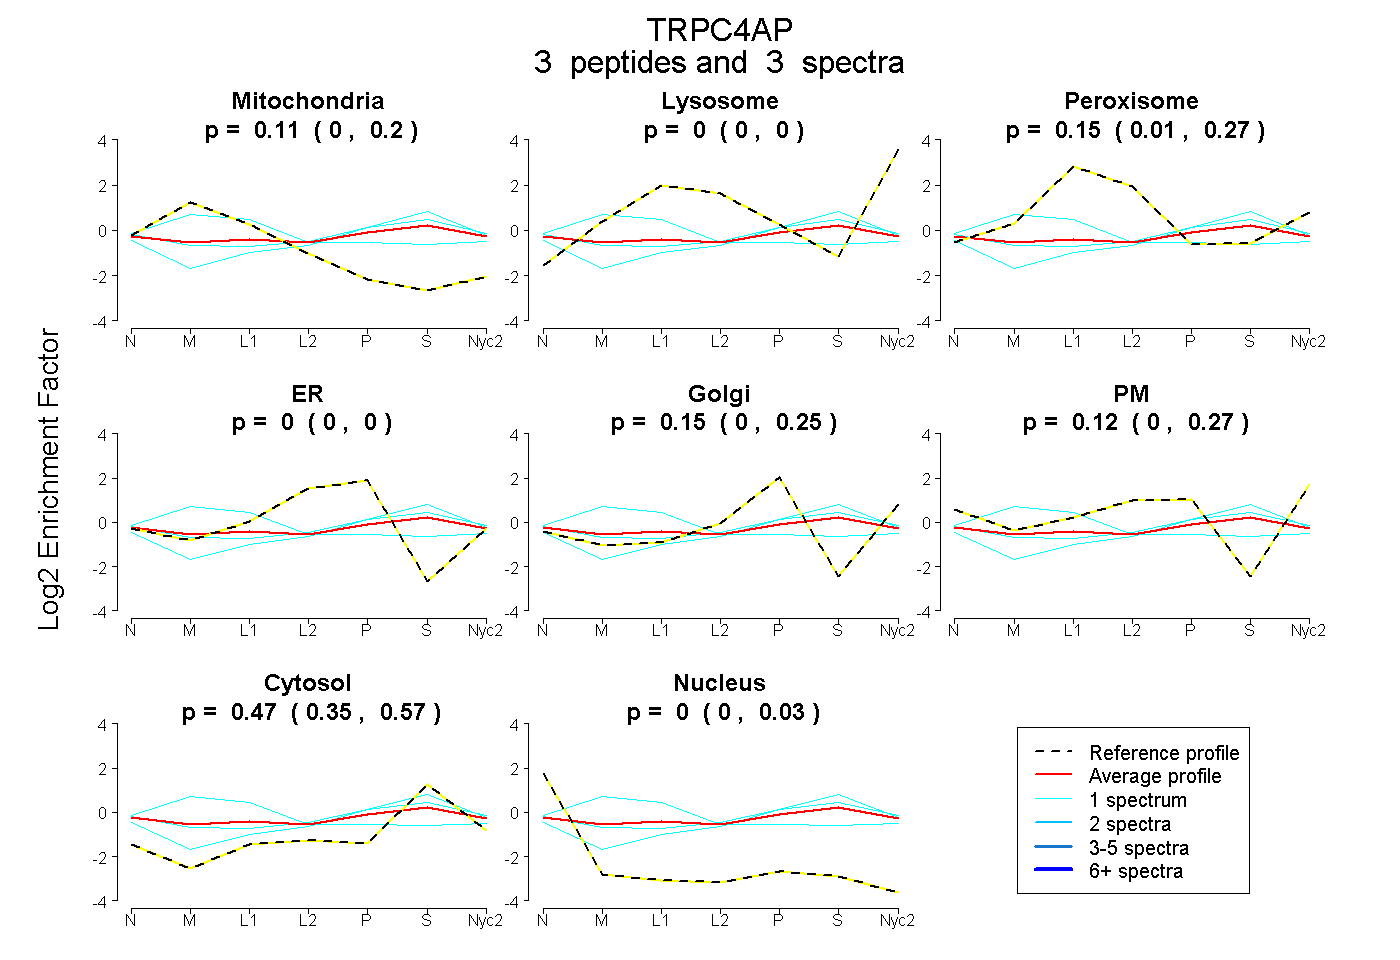
0.000 | 0.196
0.000 | 0.000
0.012 | 0.268
0.000 | 0.000
0.000 | 0.253
0.000 | 0.269
0.345 | 0.566
0.000 | 0.031
| Plot | Mito | Lyso | Perox | ER | Golgi | PM | Cytosol | Nucleus | |||||
| Expt A |
3 peptides |
3 spectra |
|
0.111 0.000 | 0.196 |
0.000 0.000 | 0.000 |
0.153 0.012 | 0.268 |
0.000 0.000 | 0.000 |
0.145 0.000 | 0.253 |
0.123 0.000 | 0.269 |
0.467 0.345 | 0.566 |
0.000 0.000 | 0.031 |
| 1 spectrum, WSGIPQLLLK | 0.036 | 0.000 | 0.099 | 0.000 | 0.110 | 0.230 | 0.526 | 0.000 | ||
| 1 spectrum, ETVSILLNPDR | 0.000 | 0.000 | 0.049 | 0.000 | 0.190 | 0.103 | 0.658 | 0.000 | ||
| 1 spectrum, AVESFLR | 0.388 | 0.006 | 0.273 | 0.000 | 0.121 | 0.026 | 0.186 | 0.000 |
| Plot | Lyso | Other | |||||||||||
| Expt C |
1 peptide |
1 spectrum |
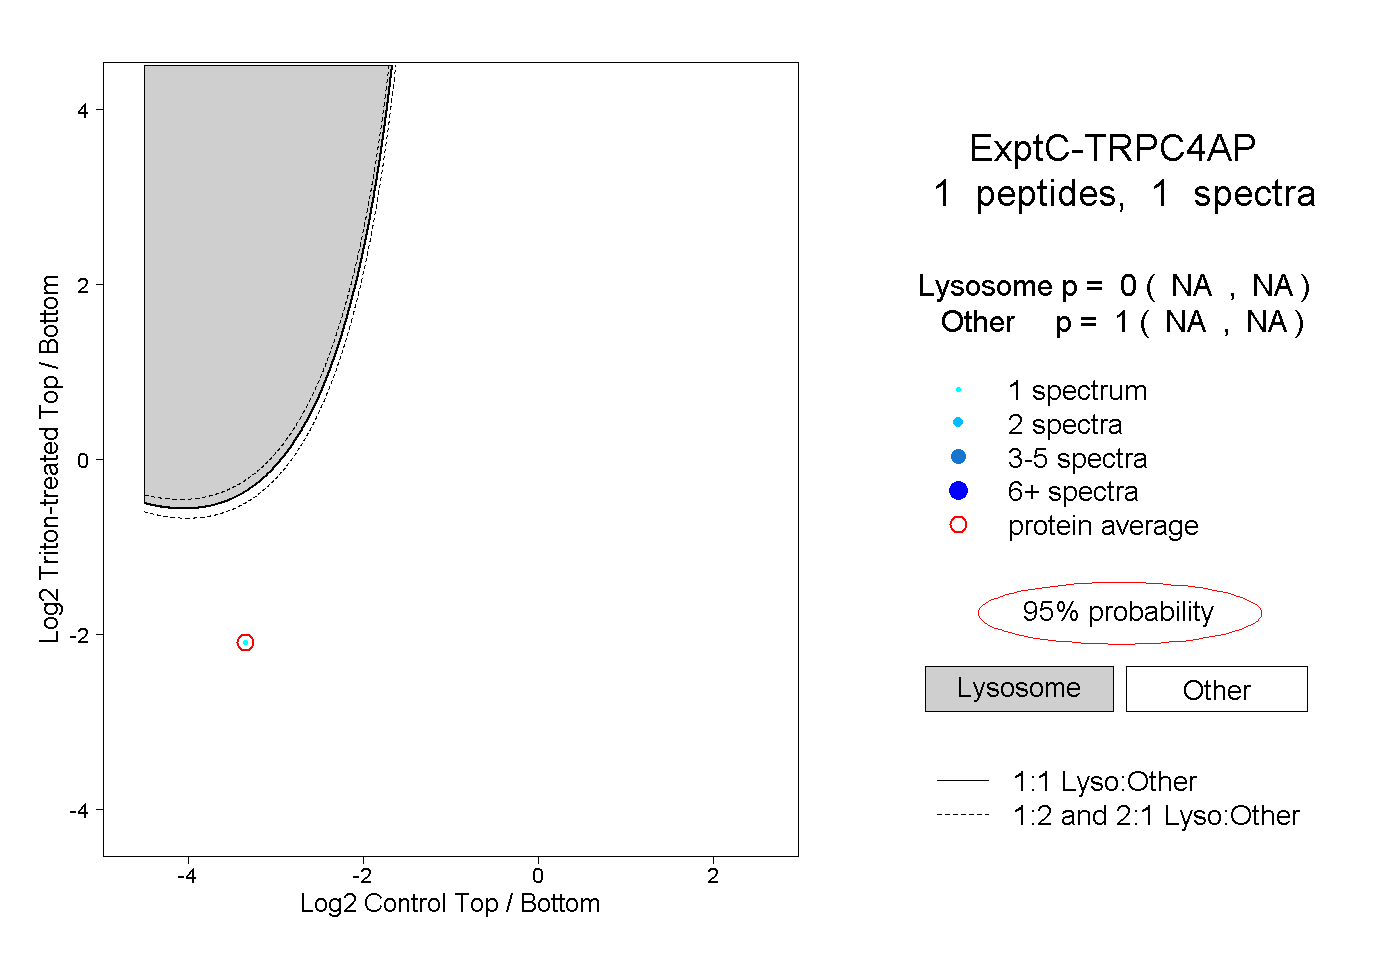 |
0.000 NA | NA |
1.000 NA | NA |