 2
2peptides
spectra
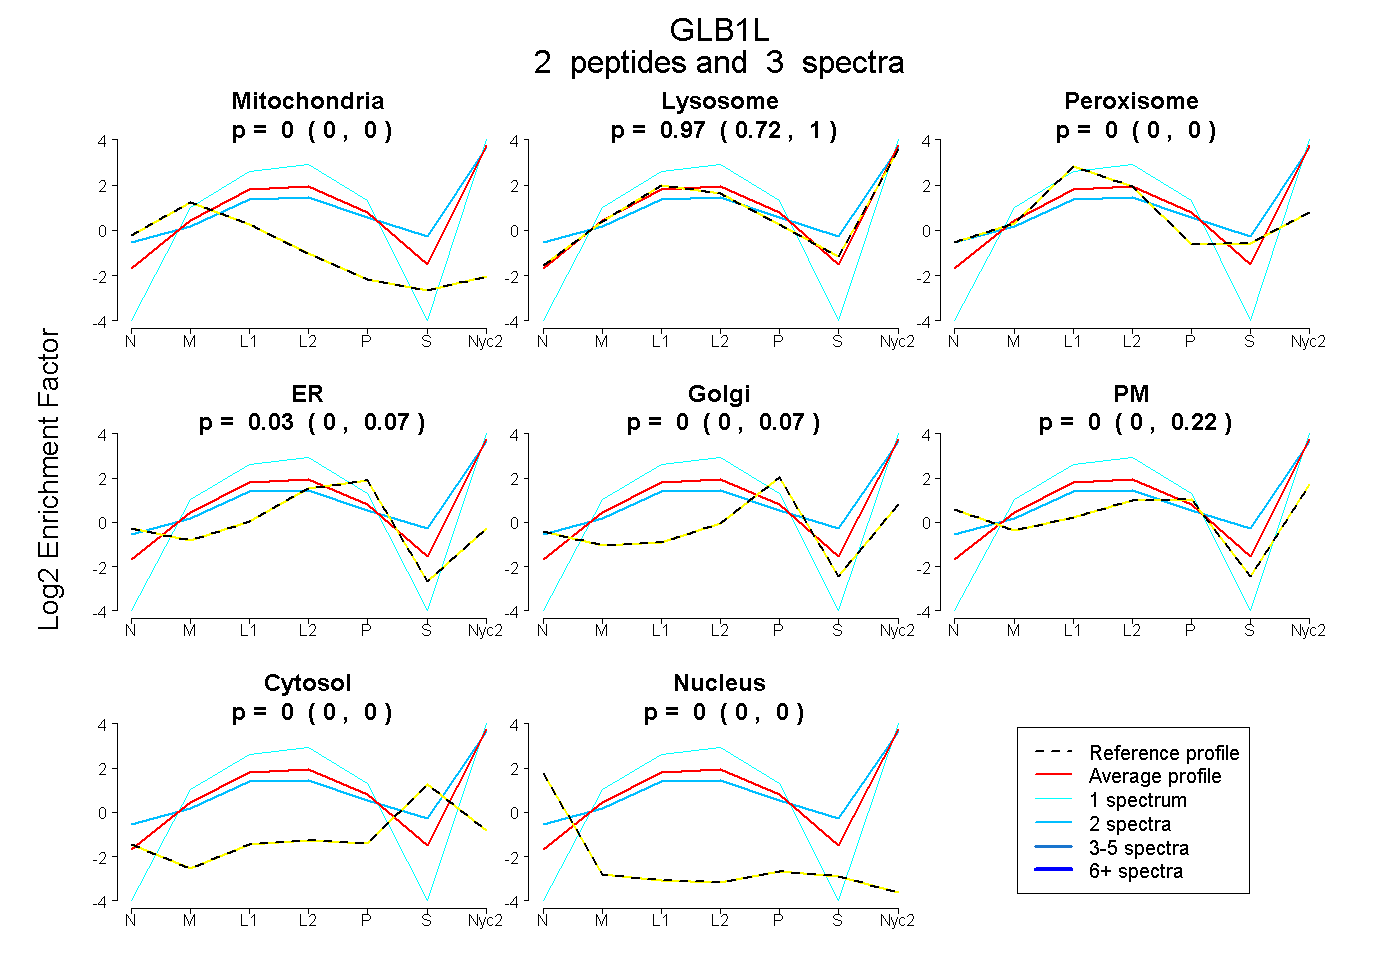
0.000 | 0.000
0.724 | 1.000
0.000 | 0.000
0.000 | 0.068
0.000 | 0.065
0.000 | 0.225
0.000 | 0.001
0.000 | 0.000
2peptides
spectra
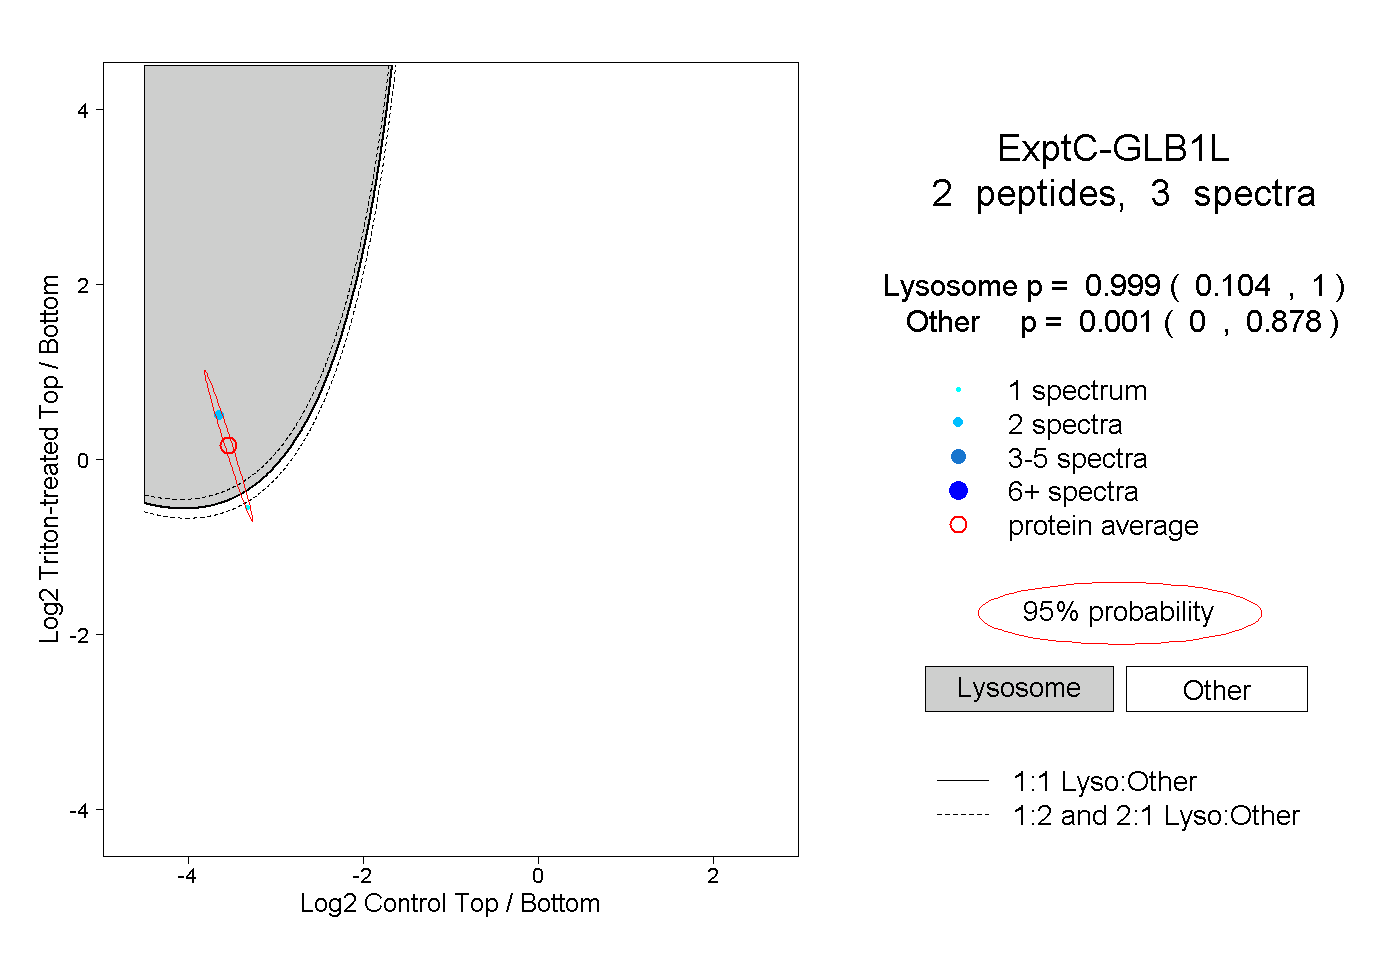
0.104 | 1.000
0.000 | 0.878
1peptide
spectrum
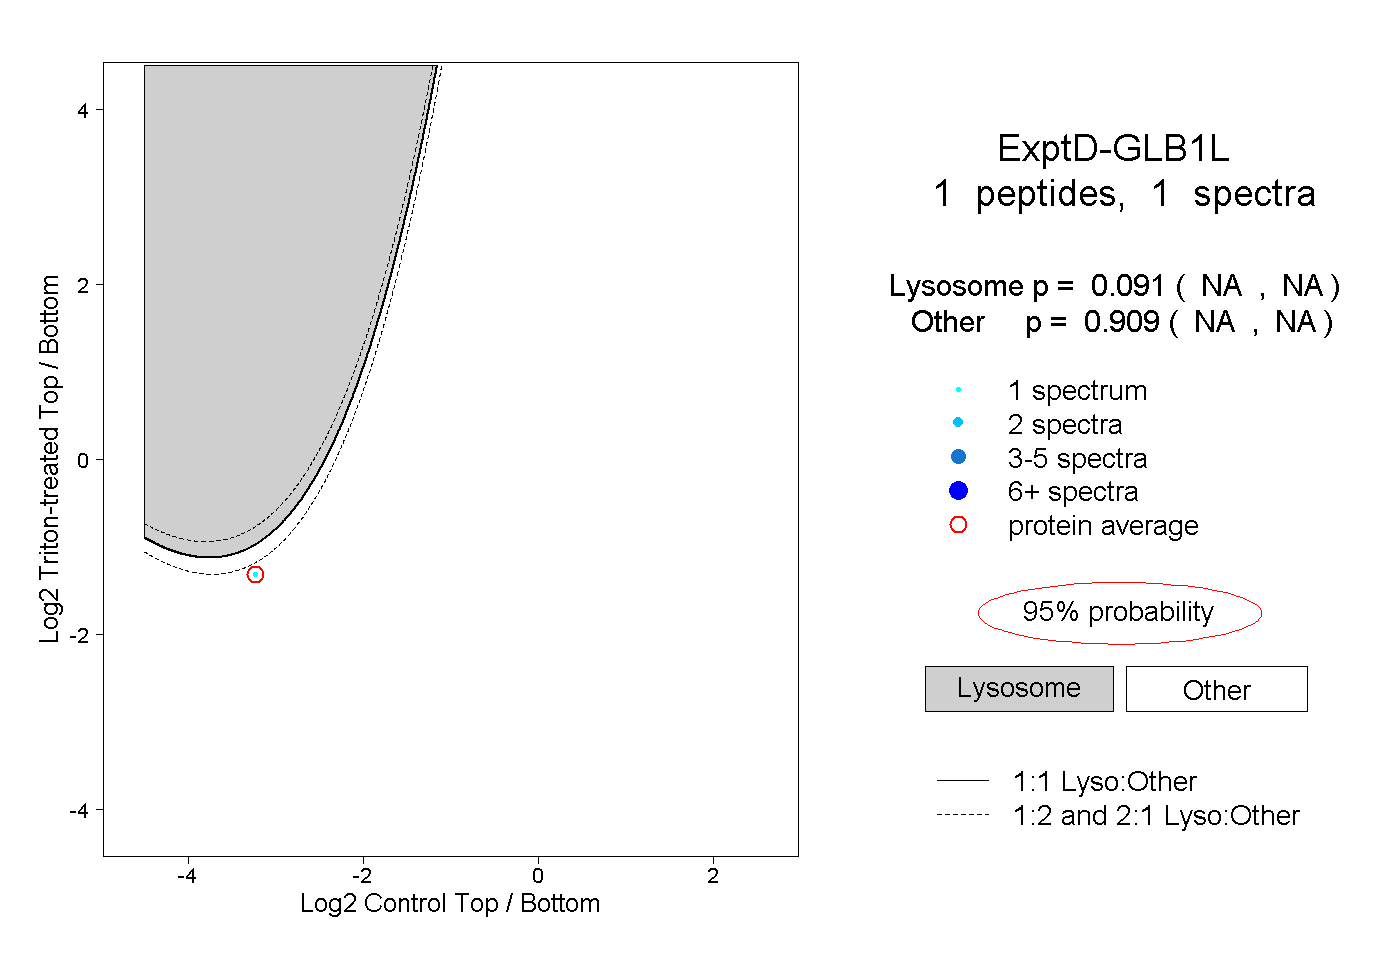
NA | NA
NA | NA