 5
5peptides
spectra
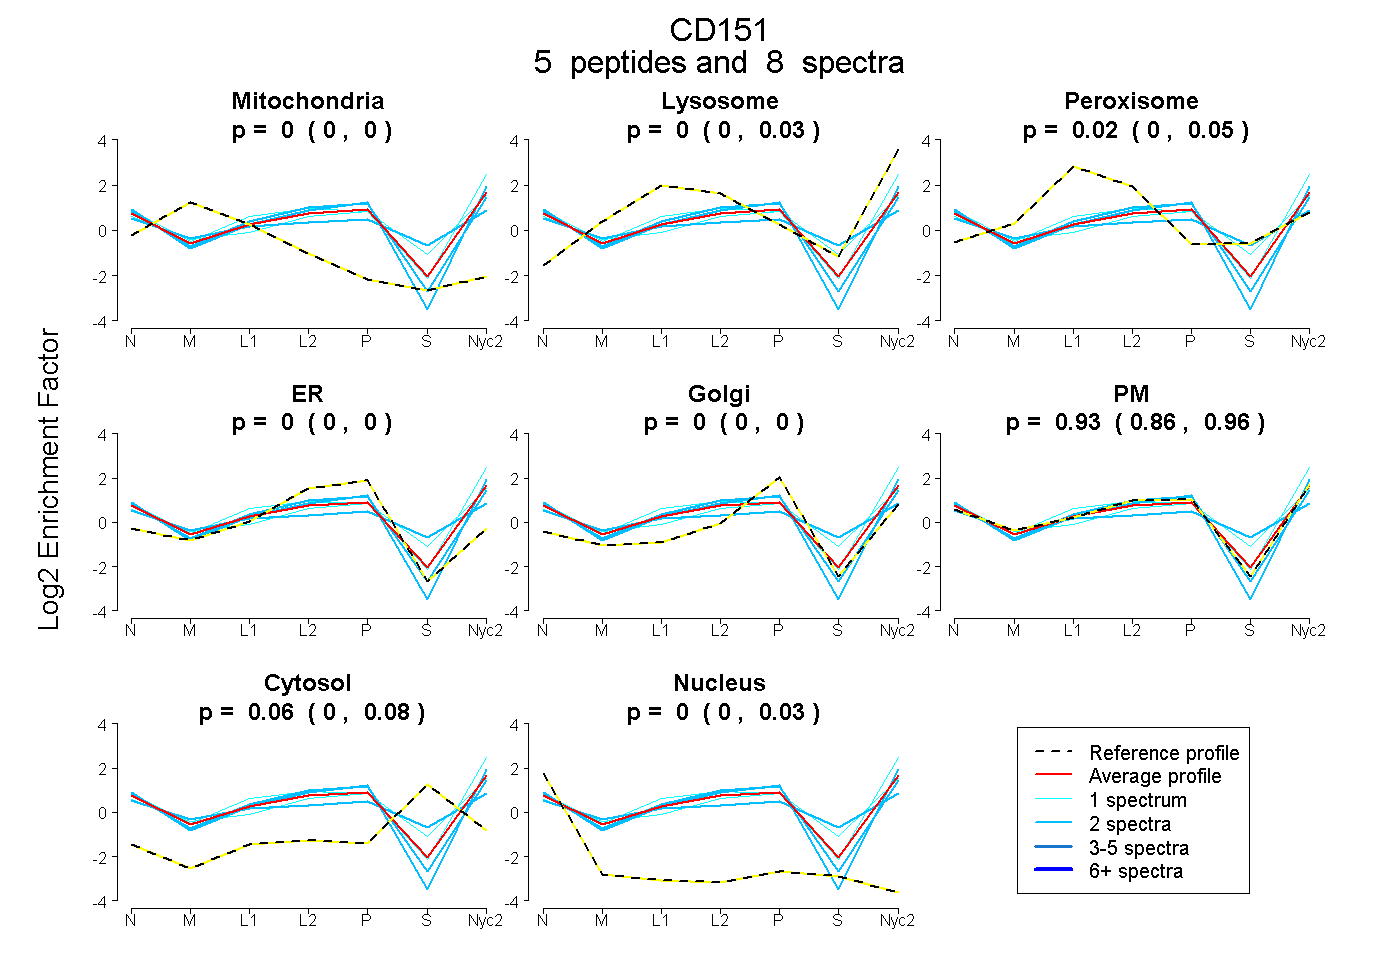
0.000 | 0.000
0.000 | 0.030
0.000 | 0.048
0.000 | 0.000
0.000 | 0.000
0.864 | 0.960
0.000 | 0.080
0.000 | 0.026
1peptide
spectra
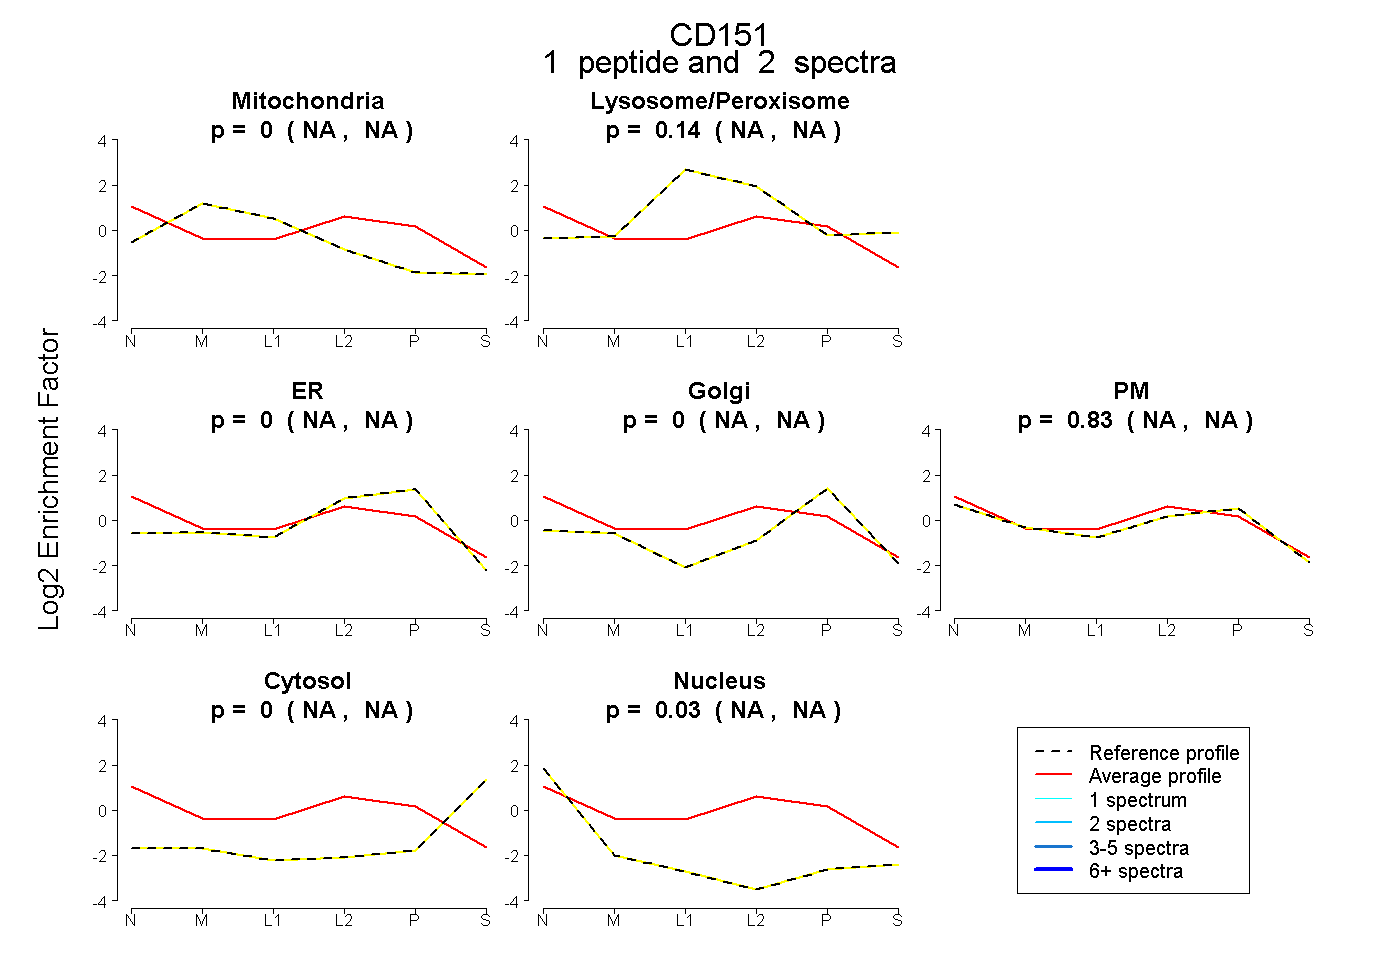
NA | NA
NA | NA
NA | NA
NA | NA
NA | NA
NA | NA
NA | NA
4peptides
spectra
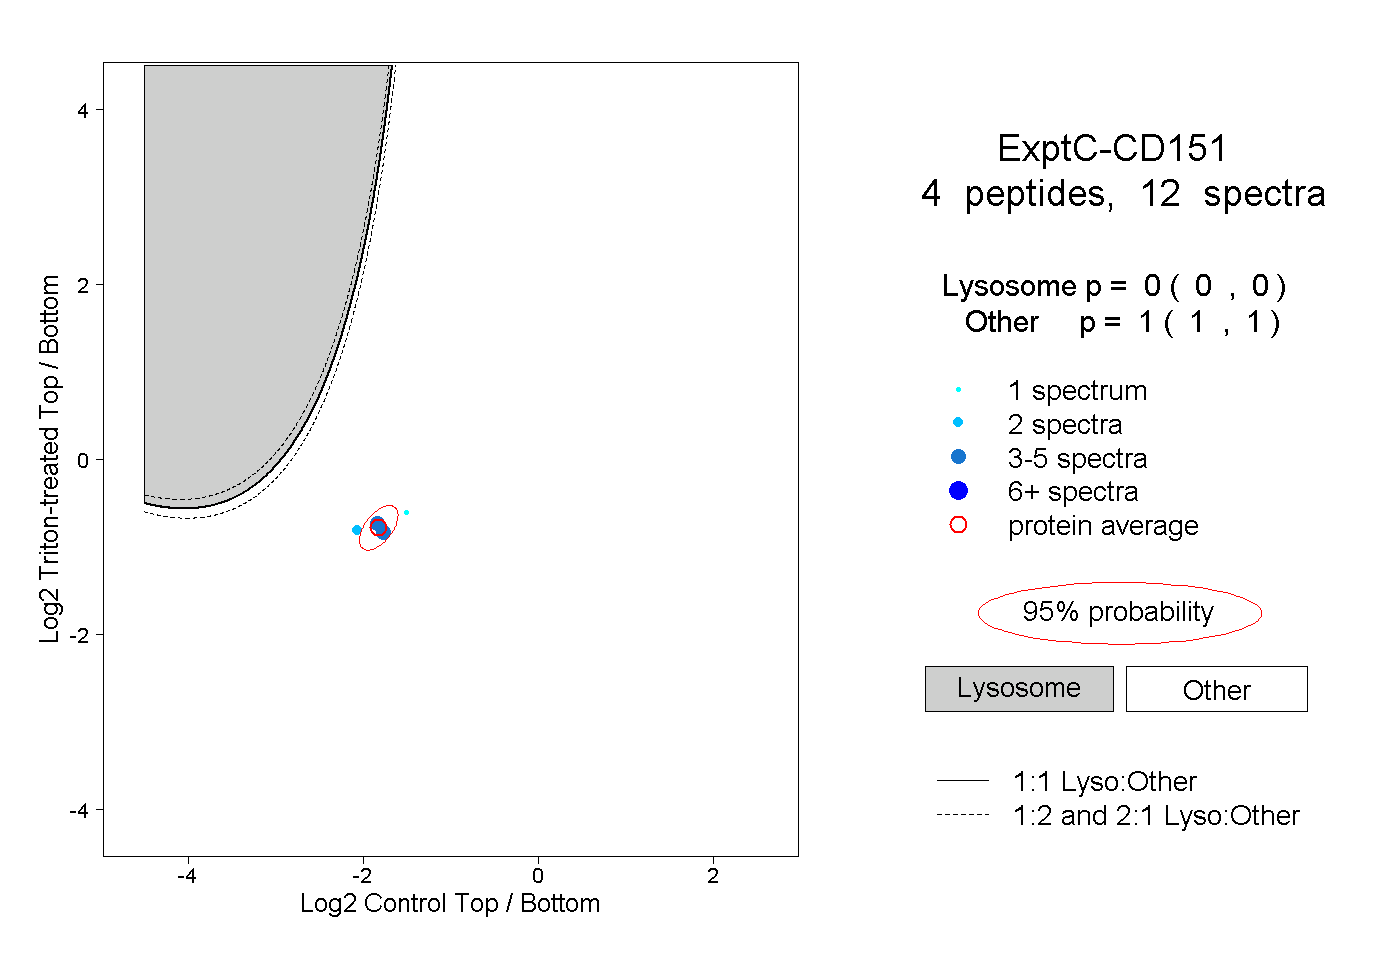
0.000 | 0.000
1.000 | 1.000